Break-Even ROAS: Formula, Margin Table and Target ROAS
Most break-even ROAS numbers are too low because they divide by product margin and stop there. Add shipping, fees and returns to one ordinary order and the line moves from 1.44× to 2.15×.

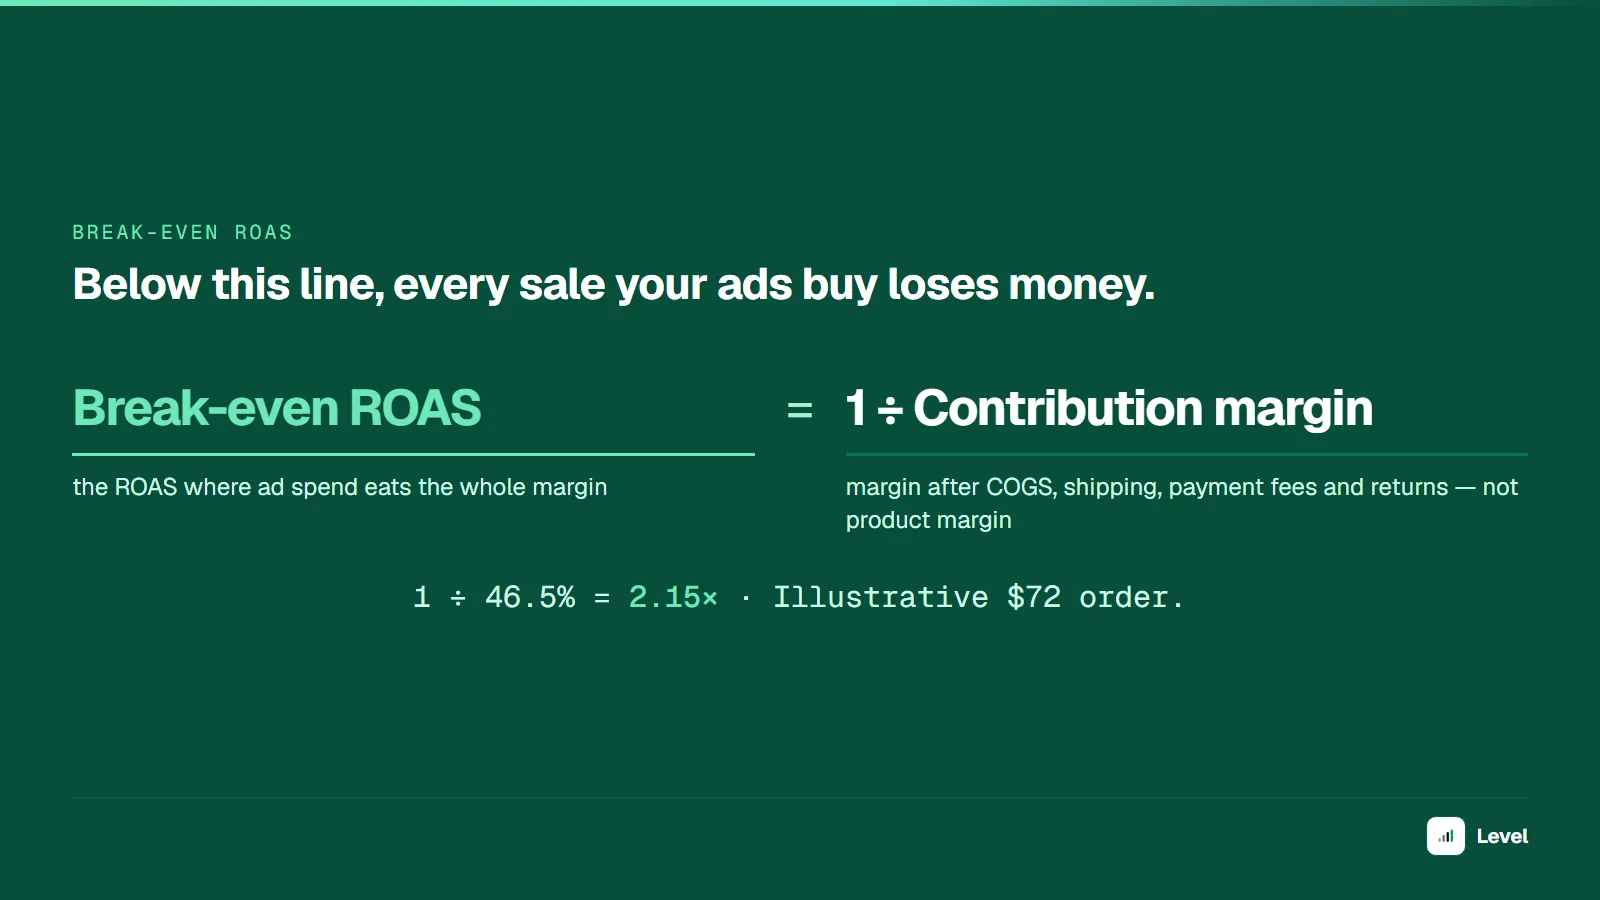
Break-even ROAS = 1 ÷ contribution margin. If each order keeps 40% of its revenue after product cost, shipping, payment fees, returns and per-order fees, your break-even ROAS is 1 ÷ 0.40 = 2.5×: every $1 of ad spend has to bring back $2.50 of attributed revenue just to cover itself. Below 2.5× you pay to sell; above it, ads add profit.
The formula is one division; the margin that goes into it is where brands get it wrong. Use gross margin from the product catalog and the line comes out too low, so campaigns that lose money look profitable.
Key takeaways
- Break-even ROAS = 1 ÷ contribution margin. 40% margin → 2.5×; 50% → 2.0×; 25% → 4.0×.
- Contribution margin is net revenue minus COGS, shipping, payment fees, returns and per-order fees. In our worked $72 order that moves break-even from 1.44× (product margin only) to 2.15×.
- Break-even CPA = net order value × contribution margin. Same line, expressed in dollars per order.
- Target ROAS = 1 ÷ (contribution margin − desired profit margin). At 46.5% margin and a 15% profit goal, that is 3.17×.
- Judge ROAS against break-even only on the same attribution setting. One real Meta account read 2.53× on its default setting and 0.52× on 7-day click, on either side of an illustrative 2.15× break-even line.
What does break-even ROAS mean?
Break-even ROAS is the return on ad spend at which the profit from ad-driven sales exactly pays for the ads. It is a per-business threshold, set by your unit economics, which is why a 3× ROAS can be a loss for one brand and very profitable for another.
The ROAS formula itself is attributed revenue ÷ ad spend. Break-even ROAS is the line you hold that number against.
The break-even ROAS formula
break-even ROAS = 1 ÷ contribution margin
               = net revenue per order ÷ contribution per order
Why it works: a sale of $R with contribution margin m leaves $R × m before ads. The ads that produced it cost $R ÷ ROAS. Profit is zero when R × m = R ÷ ROAS, so ROAS = 1 ÷ m.
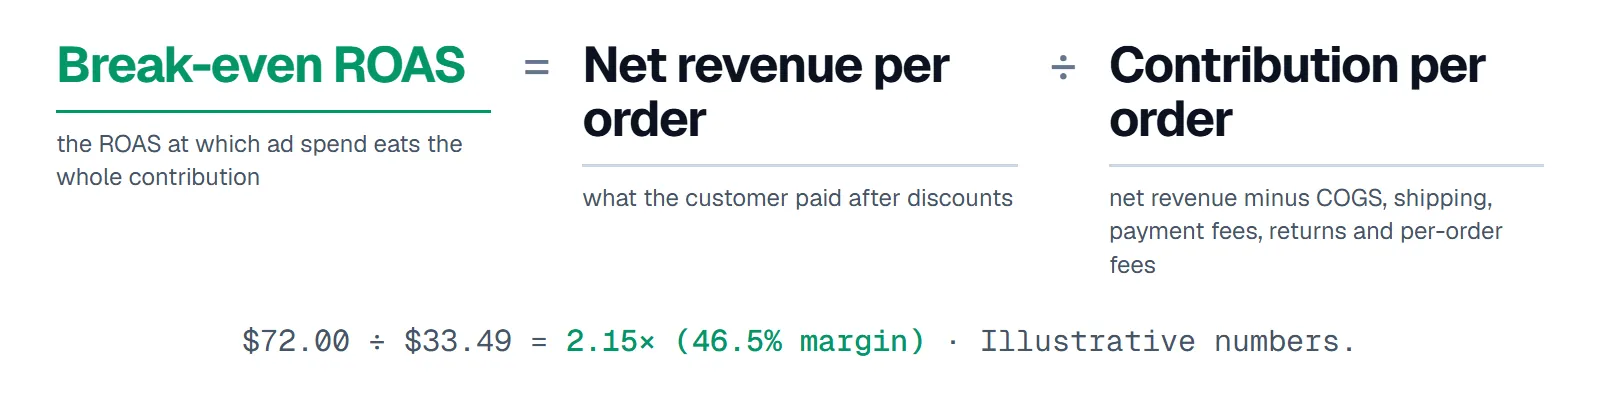
Divide net order value by what the order contributes after every variable cost. Source: illustrative unit economics.
Which costs go into the margin?
Include every cost that scales with one more order. Leave out costs that stay the same whether you ship 1,000 orders or 1,100.
| Cost | Include? | Why |
|---|---|---|
| COGS (product, packaging, inbound freight) | Yes | Paid on every unit sold |
| Outbound shipping and pick/pack | Yes | Even "free shipping" is paid by you |
| Payment processing | Yes | Shopify Payments charges 2.9% + 30¢ per US online card payment on the Basic plan (Shopify pricing, checked Oct 2026) |
| Returns and refunds | Yes, as an allowance | Refunded revenue plus return shipping, minus what you resell |
| Discounts and promo codes | Deduct from revenue, not as a cost | Margin is calculated on revenue after discounts; don't subtract them twice |
| Per-order app, 3PL or agency fees | Yes | Revenue-share and per-order fees scale with sales |
| Ad spend | No | It is what you are solving for |
| Salaries, rent, flat software subscriptions | No | Fixed costs; cover them with the profit above break-even |
Returns are easy to leave out. Across US retail, returns came to 13.21% of total sales in 2024 (Appriss Retail, 2024 Consumer Returns report). That figure is refunded sales; your allowance is the net cost after resale, so it is usually lower. The worked order below uses 6%.
A worked contribution-margin table
One order with a list price of $80 and a 10% average discount. Illustrative numbers.
| Line | Per order | % of net revenue |
|---|---|---|
| List price | $80.00 | |
| Discount (10%) | −$8.00 | |
| Net revenue (after discounts) | $72.00 | 100% |
| COGS | −$22.00 | 30.6% |
| Shipping and pick/pack | −$8.00 | 11.1% |
| Payment processing (2.9% + $0.30) | −$2.39 | 3.3% |
| Returns allowance | −$4.32 | 6.0% |
| Per-order app and agency fees | −$1.80 | 2.5% |
| Contribution before ads | $33.49 | 46.5% |
Product margin alone, ($72 − $22) ÷ $72, is 69.4%, which gives a break-even ROAS of 1.44×. The full contribution margin of 46.5% gives 2.15×. The costs outside COGS took 23 points of margin and raised the break-even line by about half. Any campaign reporting between 1.44× and 2.15× looks profitable on the first number and loses money on every order on the second. Run the same breakdown on your own order in the break-even ROAS calculator, which also returns break-even CPA and target ROAS.
How to calculate break-even ROAS, step by step
Start from net revenue
Use what the customer paid after discounts. Check whether the purchase value your ad platform reports includes shipping and tax; your margin and your ROAS must be computed on the same revenue.
Subtract every per-order cost
COGS, shipping, payment fees, a returns allowance and per-order fees. Use trailing 90-day averages from your store and 3PL, not catalog numbers.
Divide to get the margin
Contribution ÷ net revenue. In the example, $33.49 ÷ $72.00 = 46.5%.
Invert it
1 ÷ 0.465 = 2.15×. That is the minimum ROAS for the account, per order, on first purchase.
Break-even ROAS with more than one product
Use the contribution margin weighted by your actual sales mix, not the average across the catalog. If 70% of revenue comes from a 50%-margin line and 30% from a 25%-margin line, the blended margin is 0.7 × 50% + 0.3 × 25% = 42.5%, so break-even is 2.35×, while the low-margin line alone needs 4.0×. When margins differ that much, split campaigns by margin band and give each its own line. Illustrative numbers.
Check a campaign against the break-even line
Enter spend, platform-attributed revenue and your contribution margin (not product margin). If you still need the margin itself, the break-even ROAS calculator builds it from order value, product cost, shipping, fees and returns.
ROAS calculator
ROAS = attributed revenue ÷ ad spend · break-even ROAS = 1 ÷ contribution margin
- ROAS
- 3.00× 300% · 3.0:1
- ACoS
- 33%
- Break-even ROAS
- 2.86×
- Profit after ad spend
- $150
Above break-even: each sale covers its ad cost at a 35% margin.
With the defaults: 3.0× ROAS against a 2.86× break-even. The campaign clears the line, and $150 of contribution is left after $3,000 of spend.
Break-even ROAS by margin
| Contribution margin | Break-even ROAS | As % |
|---|---|---|
| 20% | 5.00× | 500% |
| 25% | 4.00× | 400% |
| 30% | 3.33× | 333% |
| 35% | 2.86× | 286% |
| 40% | 2.50× | 250% |
| 50% | 2.00× | 200% |
| 60% | 1.67× | 167% |
| 70% | 1.43× | 143% |
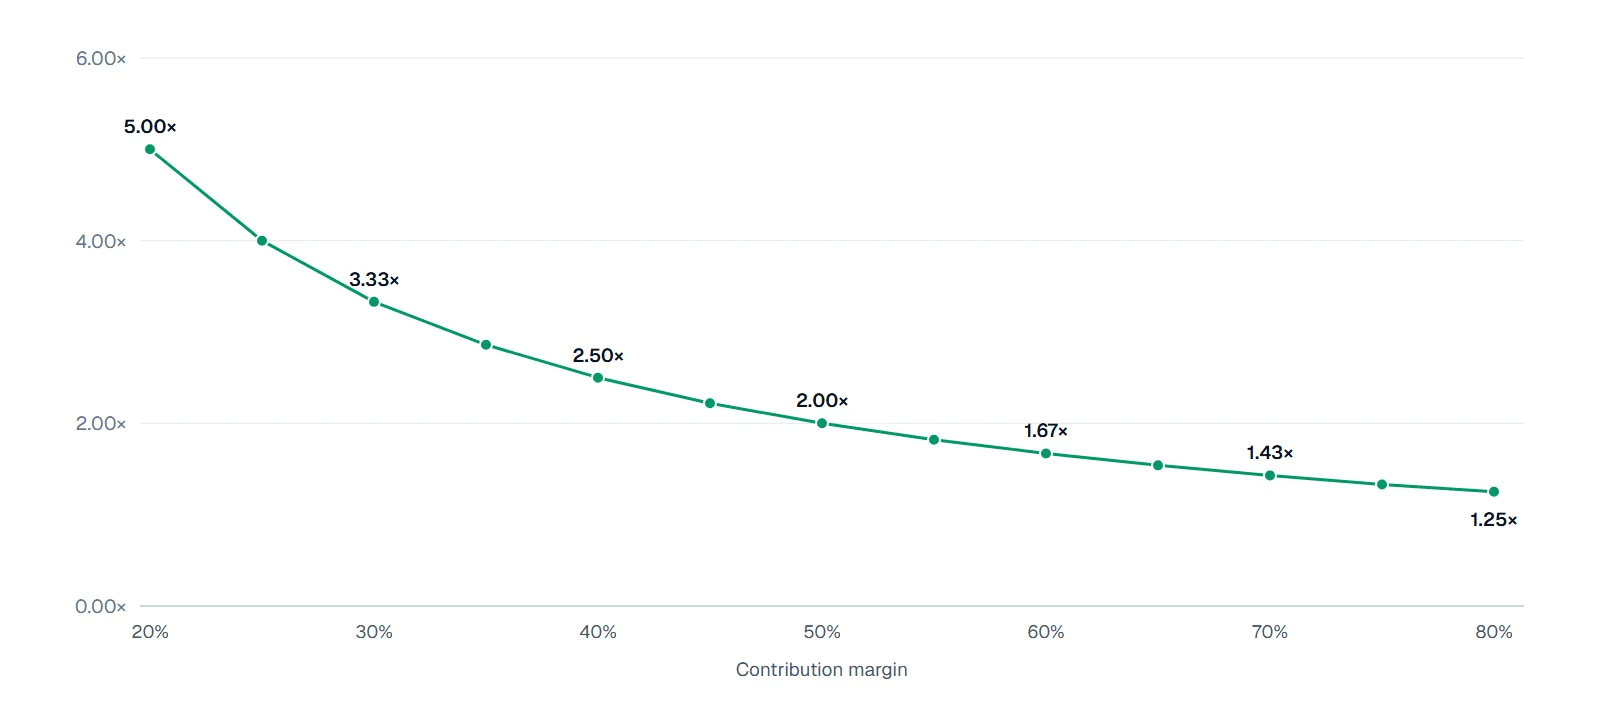
The curve is steepest at low margins: going from 20% to 30% margin moves break-even from 5.00× to 3.33×; going from 60% to 70% moves it from 1.67× to 1.43×. Source: calculated as 1 ÷ contribution margin.
That shape is the practical point. A low-margin brand gains far more from a few points of margin (cheaper shipping, fewer returns) than from a few points of ROAS. On Amazon the same line is written as break-even ACoS, which equals your margin: a 25% ACoS is a 4.0× ROAS and breaks even at exactly 25% margin.
Typical margins by DTC category
We found no public source for DTC contribution margins by category that shows its method. The closest verifiable data is gross margin by industry for US public companies, compiled by NYU Stern's Aswath Damodaran (Damodaran, Margins by Sector, January 2026). Gross margin is before shipping, fees and returns, so treat the resulting break-even as a floor.
| Industry (Damodaran) | Firms | Gross margin | Break-even ROAS on gross margin (floor) | If other costs take 15 points |
|---|---|---|---|---|
| Apparel | 35 | 56.88% | 1.76× | 2.39× |
| Beverage (soft) | 27 | 54.74% | 1.83× | 2.52× |
| Household products | 110 | 51.04% | 1.96× | 2.77× |
| Shoe | 11 | 43.88% | 2.28× | 3.46× |
| Retail (special lines) | 94 | 35.30% | 2.83× | 4.93× |
| Furniture / home furnishings | 27 | 30.28% | 3.30× | 6.54× |
| Food processing | 78 | 23.23% | 4.30× | 12.15× |
The last column is illustrative: it subtracts 15 points for shipping, fees and returns (our worked order lost 23). At 23% gross margin, 15 more points of variable cost push break-even past 12×. Many of these companies sell through wholesale and stores, so a DTC brand's own numbers will differ; use them only as a sanity check on yours.
Break-even CPA: the same line in dollars
break-even CPA = net revenue per order × contribution margin
In the worked order: $72.00 × 46.5% = $33.49. Break-even CPA and break-even ROAS are the same threshold: $72 ÷ $33.49 = 2.15×. CPA is easier to use when order values vary little; ROAS is easier when they vary a lot, because it scales with basket size.
Target ROAS: break-even plus the profit you want
Break-even is the floor. To bid or report against a profit goal, subtract the profit margin you want from the contribution margin before inverting:
target ROAS = 1 ÷ (contribution margin − target profit margin)
With the 46.5% contribution margin from the example:
| Target profit after ads (% of revenue) | Target ROAS |
|---|---|
| 0% (break-even) | 2.15× |
| 5% | 2.41× |
| 10% | 2.74× |
| 15% | 3.17× |
| 20% | 3.77× |
In Google Ads, Target ROAS is entered as a percentage (3.17× = 317%) and works as an average across auctions, not a floor, so some conversions will come in below it (Google Ads Help on Target ROAS). Set it from the same revenue definition the platform reports, or the target and the result measure different things.
Our guide to what makes a good ROAS covers how to set these targets by channel and campaign type.
First-order vs LTV-adjusted break-even
Everything above assumes the first order has to pay back the ad. If customers come back, the contribution from repeat orders can pay part of the acquisition cost:
LTV-adjusted break-even ROAS = 1 ÷ (contribution margin × LTV multiple)
The LTV multiple is 12-month (or 6-month) revenue per new customer ÷ first-order revenue. Illustrative: at a 1.4 multiple, the 2.15× first-order break-even drops to 2.15 ÷ 1.4 = 1.54×.
Four cautions before you bid to that lower line:
- Use cohort LTV, not an average across all customers. Averages mix old, loyal cohorts with new ones. The LTV by cohort breakdown shows how dashboards overstate it.
- Apply it only to new-customer revenue. Platform-attributed revenue includes returning customers, whose repeat value you would count twice.
- Use repeat-order contribution, not revenue. Repeat orders often carry different discounts and shipping costs, and retention email or SMS costs money; if their margin differs, weight it separately.
- Mind cash. Below first-order break-even you lend money to your customers until they reorder. Decide the payback window you can fund.
The customer lifetime value formula covers how to build the LTV multiple from your own order data.
How the attribution setting moves you across the line
Your break-even line does not change with attribution settings. The ROAS you compare it with does: it depends on the attribution setting the platform uses to count revenue. Here is one real DTC ad account in Level, Meta Ads, Q3 2026, with the illustrative 2.15× break-even line from our worked order:
| Meta attribution setting | Reported ROAS | Gap to break-even (2.15×) |
|---|---|---|
| Account default setting | 2.53× | +0.38 |
| 1-day view only | 0.88× | −1.27 |
| 28-day click only | 0.59× | −1.56 |
| 7-day click only | 0.52× | −1.63 |
Each value is purchase value ÷ spend as Meta's API returned it for the account's default setting and for each single window, July–September 2026, counting one purchase event; the default is not the sum of the single-window settings. The brand is anonymized and absolute amounts are withheld. The worked order, the 46.5% margin and the 2.15× break-even line are illustrative, not that brand's economics, and one account is no benchmark. The ROAS formula guide shows the same account in more detail.
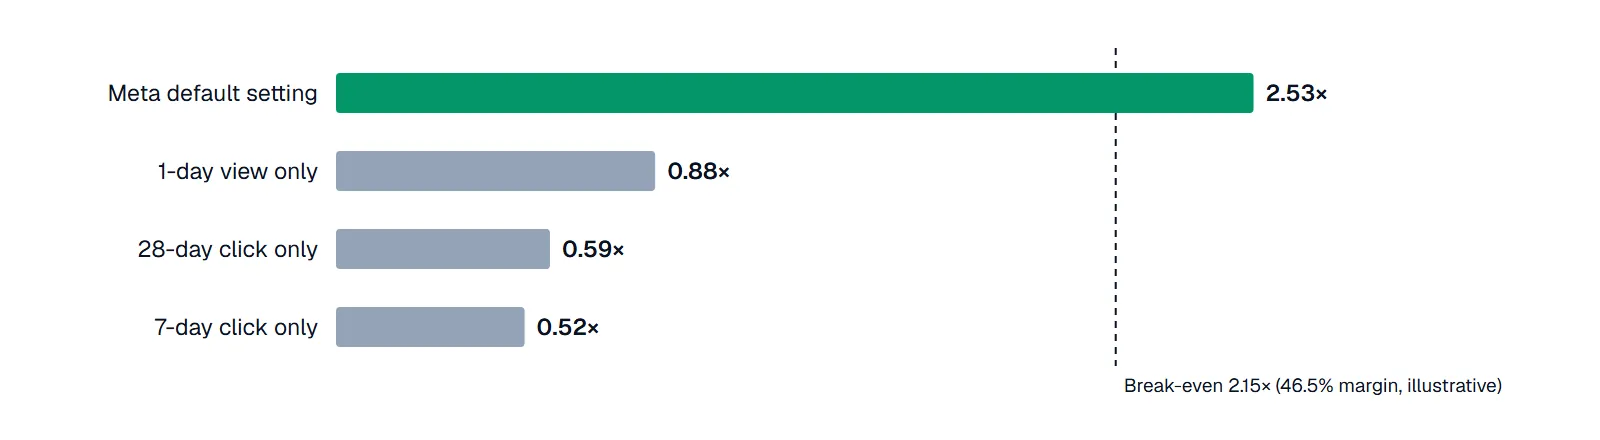
One account, one quarter, one break-even line; only the default setting clears it. Source: Level, anonymized DTC Meta Ads account, Q3 2026. Break-even line illustrative.
Same spend in the same quarter, yet the account looks profitable or deeply unprofitable depending on which column you read. Two rules follow:
- Fix one attribution setting for the break-even comparison and write it in the report. Comparing a default-setting ROAS this month with a 7-day-click ROAS last month will show a collapse that never happened.
- Calibrate against your backend. Platform ROAS is the platform's claim. Check total revenue ÷ total ad spend (MER) from your store against blended break-even; the ROAS vs ROI vs MER guide shows how the three fit together. If MER sits well below what platform ROAS implies, your break-even comparison is too generous.
A break-even line in a dashboard needs platform spend and revenue on one fixed attribution setting plus margin inputs from the store and 3PL. Level covers the platform side: Meta and Google Ads sync hourly into one report, with revenue mapped to the purchase event you choose. To see that side on your own accounts, book a Level demo. When margin data lives in separate systems, a custom reporting setup joins them.
FAQ
Divide 1 by your contribution margin. Contribution margin is net revenue minus COGS, shipping, payment fees, returns and per-order fees, as a share of net revenue. At a 40% margin, break-even ROAS is 1 ÷ 0.40 = 2.5×.
It is the ROAS at which the profit from ad-driven sales exactly covers the ad spend. Above it, ads add profit; below it, each sale costs more in ads than it contributes.
A lower break-even ROAS is better, because it leaves more room for ads to work: 2.0× (50% margin) is easier to beat than 4.0× (25% margin). For a running campaign, what matters is actual ROAS ÷ break-even ROAS on the same attribution setting; above 1.0 the campaign is profitable per order.
Yes, on media. At break-even ROAS, the return on ad spend measured in profit (ROI) is zero: contribution from the sales equals the ad spend. ROI = (contribution − ad spend) ÷ ad spend, so any ROAS above break-even gives a positive ROI on media.
Only at a 50% contribution margin. Break-even ROAS is 1 ÷ margin, so 2.0× breaks even at 50%; at a 40% margin it loses money on every order, at 60% it is profitable.
Contribution margin. Gross margin leaves out shipping, payment fees and returns, so the break-even line comes out too low. In our worked order it read 1.44× on product margin and 2.15× on contribution margin.