What Is a Good ROAS? Targets by Margin and Channel
Benchmarks tell you what other brands report. Your margin tells you what you can afford. One DTC account shows why a single 'good ROAS' number doesn't survive contact with seasons and channels.

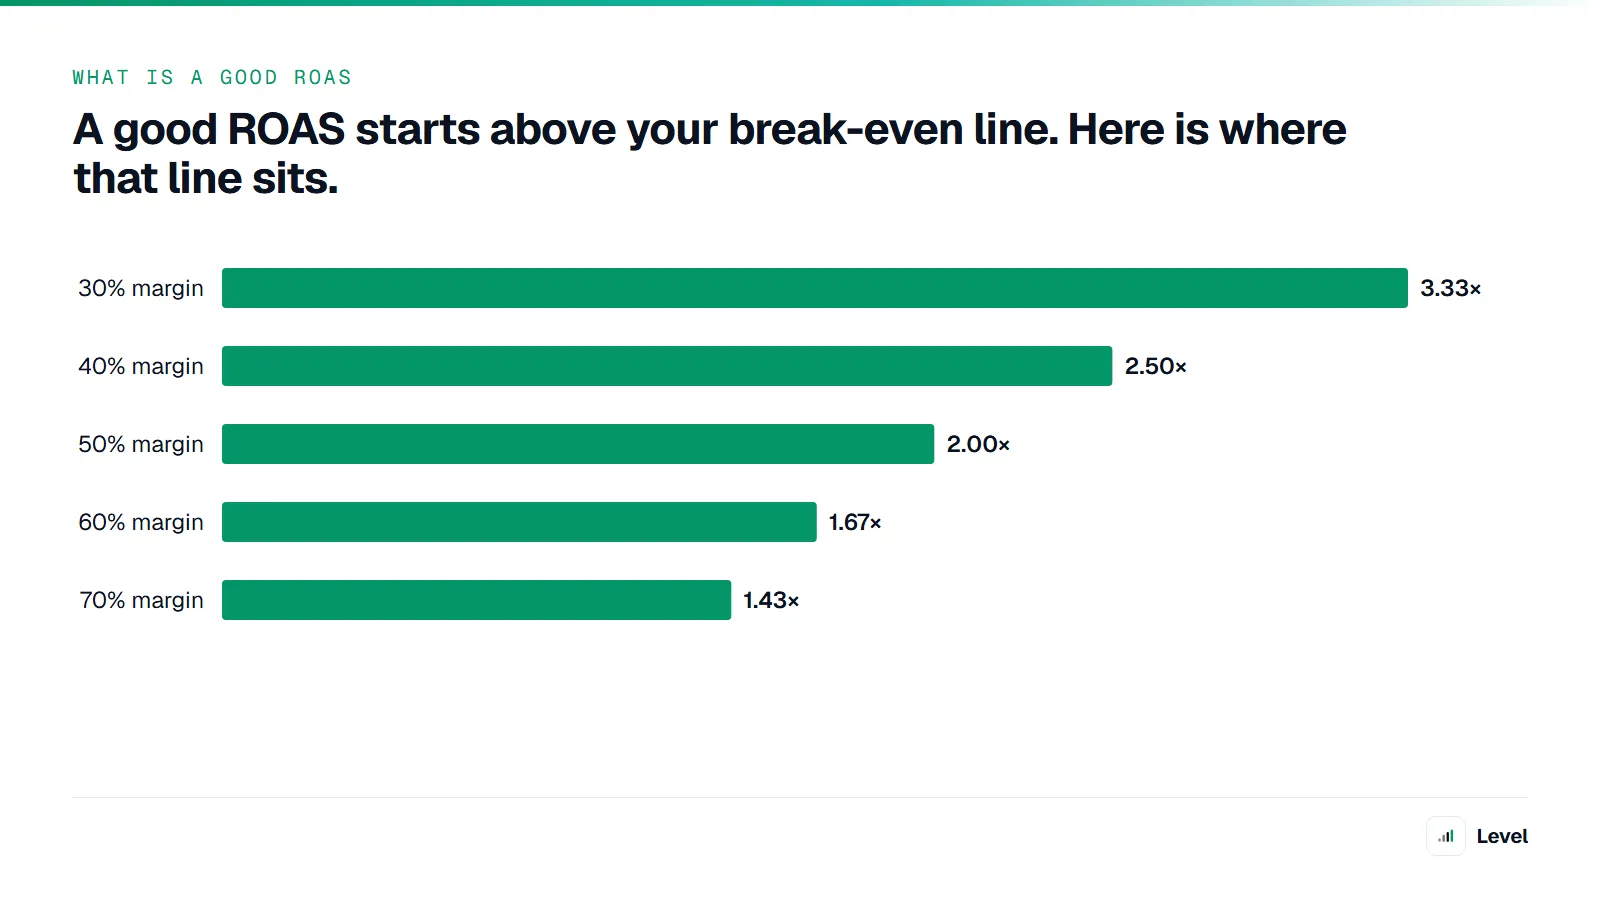
A good ROAS is any ROAS above your break-even ROAS (1 ÷ contribution margin, so 2.5× at a 40% margin) with room left for profit; published medians are about 2× on Meta and 3.3–3.5× on Google Ads. At a 40% margin, 3.3× leaves 10% of revenue as profit after ads. At a 25% margin, break-even is 4.0×, and the commonly quoted "4:1 is good" only gets you to zero.
Below: the target ROAS for your margin (computed), the public medians by channel and DTC category, and seven quarters of ROAS from one real DTC brand in Level, where the same account ran from 2.31× to 7.68× depending on the quarter and the channel.
Key takeaways
- Break-even ROAS = 1 ÷ contribution margin. A 40% margin breaks even at 2.5×, a 50% margin at 2.0×, a 25% margin at 4.0×.
- Target ROAS = 1 ÷ (contribution margin − profit goal). At a 40% margin and a 10% profit goal, target 3.33×.
- Public medians: Meta 2.19× and Google Ads 3.31× (Varos, April 2025); Google Ads 3.52× (Focus Digital, 2026). Treat them as a range.
- One DTC brand, Q1 2025 – Q3 2026: Meta 2.31×–5.29×, Google Ads 5.34×–7.68×. Q4 was the high on both. ROAS targets need a season and a channel attached.
- Prospecting, retargeting and brand search should not share a ROAS target. Judge prospecting on new-customer ROAS, not blended.
What is a good ROAS?
ROAS (return on ad spend) is attributed revenue ÷ ad spend — the ROAS formula covers how to calculate it and what changes the number. A "good" ROAS is a ROAS that pays for the product, the shipping, the fees and the ads, and leaves profit. Which value does that depends on your margin more than on your industry.
The line that matters is break-even ROAS:
break-even ROAS = 1 ÷ contribution margin
Margin here means what is left of a dollar of revenue after cost of goods, shipping, payment fees and returns (strictly, contribution margin; see the break-even ROAS guide). If that is 40 cents, you need $2.50 of revenue to cover $1 of ads. Below 2.5× you pay to sell; above it, each sale covers its ad cost. To work it out from your own order costs, use the break-even ROAS calculator.
Target ROAS by margin
Break-even is the floor. A target adds the profit you want left over, as a share of revenue:
target ROAS = 1 ÷ (contribution margin − profit goal)
| Contribution margin | Break-even ROAS | Target for 10% profit | Target for 20% profit |
|---|---|---|---|
| 25% | 4.00× | 6.67× | 20.00× |
| 30% | 3.33× | 5.00× | 10.00× |
| 40% | 2.50× | 3.33× | 5.00× |
| 50% | 2.00× | 2.50× | 3.33× |
| 60% | 1.67× | 2.00× | 2.50× |
| 70% | 1.43× | 1.67× | 2.00× |
| 80% | 1.25× | 1.43× | 1.67× |
Computed from the formulas above; "profit" is contribution after product costs and ad spend, before overhead.
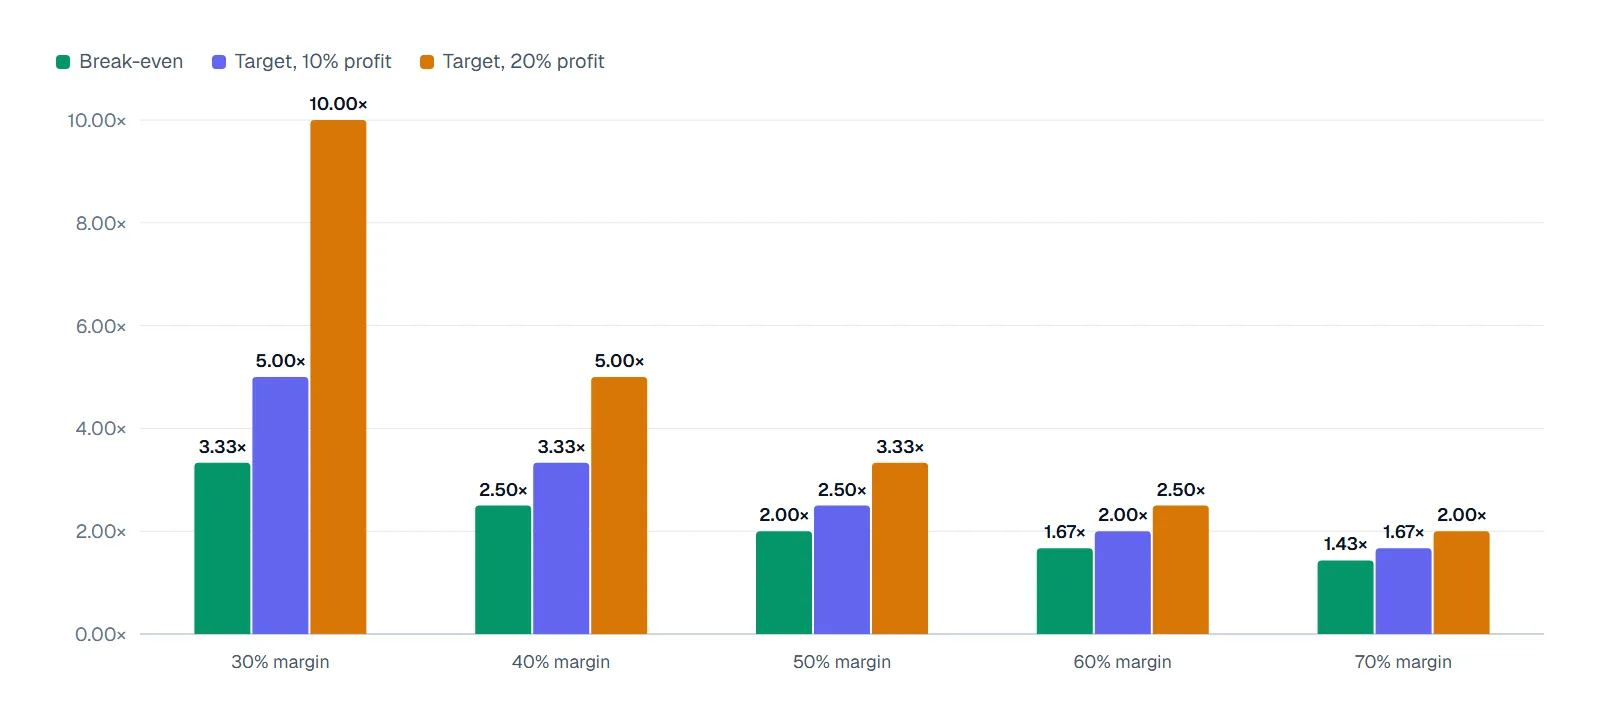
At a 40% margin, break-even is 2.50× and a 10% profit goal needs 3.33×. Source: target ROAS = 1 ÷ (margin − profit goal).
Low-margin products climb fast: at 25% margin, a 20% profit goal needs 20× ROAS, which no channel delivers at scale, so profit there has to come from repeat purchases, not the first order. And high-margin products can run "bad-looking" ROAS profitably: at 70% margin, 2.0× leaves 20% of revenue as profit.
Plug your own numbers in:
ROAS calculator
ROAS = attributed revenue ÷ ad spend · break-even ROAS = 1 ÷ contribution margin
- ROAS
- 3.00× 300% · 3.0:1
- ACoS
- 33%
- Break-even ROAS
- 2.50×
- Profit after ad spend
- $1,000
Above break-even: each sale covers its ad cost at a 40% margin.
Average ROAS benchmarks by channel
Benchmarks answer "what do other brands report", which is a different question from "what can I afford". With that caveat, these are the public figures we could verify on the source pages (checked Oct 2026):
| Source | Sample and period | Meta (Facebook) Ads | Google Ads |
|---|---|---|---|
| Varos via WhatConverts (2025) | 33 industries, data updated April 2025 | 2.19× median | 3.31× median |
| Focus Digital (2026) | 5,000+ Google Ads accounts, March 2025 – April 2026 | — | 3.52× median; Search 5.17×, Performance Max 3.12×, Shopping 2.88× |
The Google Ads median is 3.31× in one study and 3.52× in the other. Focus Digital's figure partly draws on Varos data, so the two are not independent, and its methodology aggregates several sources rather than one platform's raw accounts. Triple Whale (2025) reports a 2.04× median ROAS for brands on its platform in 2024, as one figure across channels. Take the honest reading: median Meta ROAS is around 2×, median Google Ads ROAS is around 3–3.5×, and the spread by industry is wider than the gap between channels: Varos reports Google Ads medians from 0.04× for software development services to 15.19× for hotels.
Consumer-product categories from the same dataset (Varos data as published by WhatConverts, April 2025). The source lists 33 industries without a DTC label; these nine are our pick of the ones closest to DTC:
| DTC category | Google Ads median ROAS | Meta median ROAS |
|---|---|---|
| Beauty | 3.07× | 1.57× |
| Personal Care | 3.05× | 1.48× |
| Food & Beverage | 3.20× | 1.69× |
| Pet Care | 2.55× | 1.69× |
| Baby Care | 6.09× | 2.49× |
| Furniture | 3.87× | 4.67× |
| Kitchenware | 4.81× | 3.28× |
| Home Improvement | 4.07× | 3.94× |
| Textiles | 2.91× | 2.90× |
A median describes the middle brand. Half of the advertisers in each sample are below it, and many of them are still profitable because their margins are high.
What is a good ROAS for Facebook (Meta) ads?
Against benchmarks, around 2× is the median. Against your business, it is your break-even plus profit goal. Meta mostly shows ads to people who were not searching for you, so its attributed ROAS tends to run lower than search; that shows in the overall Varos medians (2.19× vs 3.31×) and in the account below.
What is a good ROAS for Google Ads?
The Google Ads medians cluster at 3.3–3.5×, but campaign type matters more than the platform: Focus Digital reports Search at 5.17× and Shopping at 2.88× in the same dataset. Brand search inflates the average because it collects people who already decided to buy.
How much ROAS moves in one real account
The benchmarks above are cross-sections. Here is the same brand over time. One DTC brand in Level, Meta Ads and Google Ads, platform-reported ROAS by quarter over the seven quarters both channels were tracked:
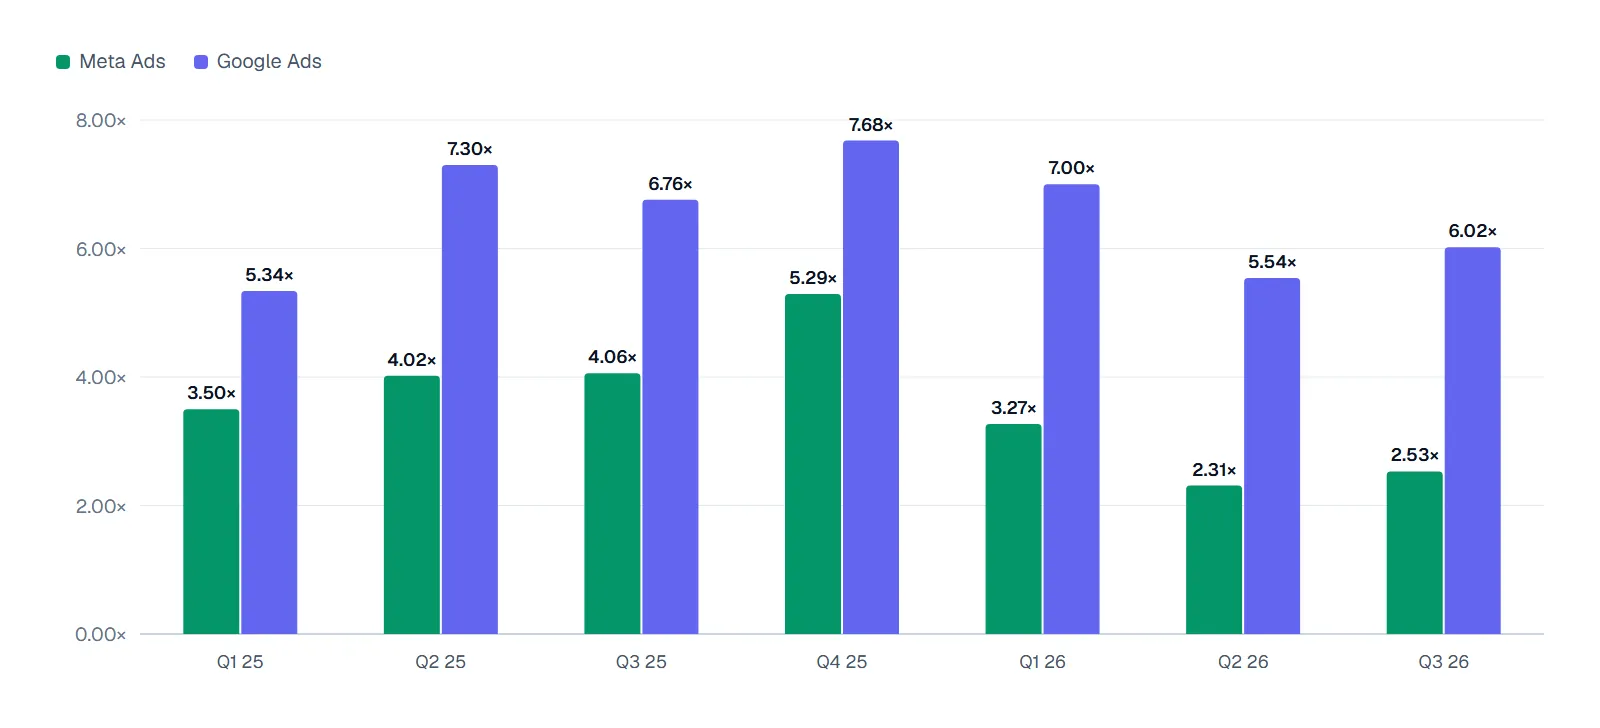
Google Ads ROAS was higher every quarter; both channels peaked in Q4 2025. Source: Level, anonymized DTC ad account, platform-reported purchase value ÷ spend, Q1 2025 – Q3 2026.
| Quarter | Meta ROAS | Google Ads ROAS |
|---|---|---|
| Q1 2025 | 3.50× | 5.34× |
| Q2 2025 | 4.02× | 7.30× |
| Q3 2025 | 4.06× | 6.76× |
| Q4 2025 | 5.29× | 7.68× |
| Q1 2026 | 3.27× | 7.00× |
| Q2 2026 | 2.31× | 5.54× |
| Q3 2026 | 2.53× | 6.02× |
What this one account shows:
- ROAS is seasonal. Q4 2025 was the high on both channels (5.29× Meta, 7.68× Google), and Meta fell to 3.27× the next quarter.
- Channels sit at different levels. Google ran 5.34×–7.68× while Meta ran 2.31×–5.29×. Meta's best quarter (5.29×) was still below Google's worst (5.34×). One account-wide ROAS target would push budget toward Google every time, even though the two channels do different jobs.
- The swing is bigger on Meta. Meta's best quarter was 2.3 times its worst; Google's was 1.4 times. Over 13 quarters (Q3 2023 – Q3 2026) Meta ranged from 2.31× to 5.29× while quarterly spend stayed within a 14% range (see the ROAS formula guide).
This does not show which channel is more profitable. Each platform credits sales with its own attribution rules, and both may claim the same order. Compare each channel to its own history, for the same quarter of the previous year, and judge the business on MER (total revenue ÷ total ad spend). Our ROAS vs ROI vs MER breakdown covers when each one is the right number.
Is a 2×, 3× or 4× ROAS good? Lookup table
Each ROAS value implies a minimum margin: break-even margin = 1 ÷ ROAS. For a 10% profit, add 10 points.
| ROAS | Also written as | Covers ad cost if margin above… | Margin needed for 10% profit |
|---|---|---|---|
| 1.5× | 150% | 66.7% | 76.7% |
| 2.2× | 220% | 45.5% | 55.5% |
| 3.0× | 300%, 3:1 | 33.3% | 43.3% |
| 3.8× | 380% | 26.3% | 36.3% |
| 4.0× | 400%, 4:1 | 25.0% | 35.0% |
| 5.0× | 500% | 20.0% | 30.0% |
| 7.0× | 700% | 14.3% | 24.3% |
A 7× ROAS can still be a warning sign. If it comes from campaigns that mostly reach existing customers, it measures demand you collected; prospecting is where new demand gets created.
Why prospecting, retargeting and brand search need separate targets
Different campaigns reach different people, so they produce different ROAS by design:
- Prospecting (cold audiences, Advantage+ broad, YouTube, Demand Gen) reaches people who did not know you. Lowest ROAS, and the campaigns that bring in most first-time buyers.
- Retargeting reaches site visitors and cart abandoners. High ROAS, because many of those people were going to buy anyway.
- Brand search catches people typing your name. Usually the highest ROAS in the account, for the same reason.
If all three share one target, the budget drifts toward retargeting and brand search, prospecting gets cut, and a few quarters later the pool those campaigns harvest is smaller. Set a floor per campaign type: prospecting at or near break-even on new-customer revenue, retargeting and brand search well above it, with a cap on their share of spend.
New-customer ROAS vs blended ROAS
New-customer ROAS counts only revenue from first-time buyers ÷ ad spend. Blended ROAS counts every attributed order.
Illustrative numbers. A campaign spends $10,000 and is credited with $40,000 in revenue: 4.0× blended. If $16,000 of that came from first-time buyers, new-customer ROAS is 1.6×. At a 40% margin, the blended number looks healthy and the new-customer number sits below the 2.5× break-even: the campaign is mostly reselling to existing customers.
Below break-even on new-customer ROAS can still be the right call, if repeat purchases pay back the first order. That is a lifetime-value decision: decide how many months of repeat revenue you count, write it down, and use it as the prospecting target. Without that, use break-even.
Quarterly ROAS from one Level account
The 13 quarters of Meta ROAS and the Google Ads quarters since Q1 2025 are read from one DTC brand's accounts connected to Level. Meta ROAS is platform-reported purchase value ÷ spend on the account's default attribution setting, counting one purchase event. Google Ads ROAS uses the Shopping App purchase conversion action, tracked since December 2024, so the comparison starts in Q1 2025. We did not adjust or model the values. The brand is anonymized and absolute amounts are withheld; its swings describe that one store only. The margin tables are arithmetic from the two formulas above. Benchmarks are quoted from the linked sources as published; we did not re-run them.
Setting a ROAS target you can defend
Compute break-even from your real margin
Contribution margin: revenue minus COGS, shipping, payment fees and returns. Break-even ROAS = 1 ÷ that margin.
Add your profit goal
Target ROAS = 1 ÷ (margin − profit goal). Use the table above.
Split by campaign type
Prospecting judged on new-customer ROAS; retargeting and brand search on blended, with a spend cap.
Set it per season
Compare each quarter to the same quarter last year, not to the previous quarter.
Check against the backend
Platform ROAS is the platform's claim. MER from your order system tells you whether the business grew.
Doing this every week by hand is where reports go wrong: a target from one season compared against another, or blended and new-customer ROAS mixed in one column. In Level, revenue is a metric you define once per account, and dashboards show each channel against its own target and its own history; the marketing KPI dashboard guide shows the layout. To set per-channel targets on your own accounts, book a Level demo. If your agency reports one blended ROAS against a generic "4:1 is good", read why most agency reports lie, or have the reporting built around your margins.
FAQ
Above 10,000 ÷ your margin in percent, plus room for profit: at 40% margin, 250% breaks even and 333% leaves 10% profit.
Only at high margins: it covers ad cost above a 66.7% margin and leaves 10% profit above 76.7%.
It covers ad cost above a 45.5% margin and leaves 10% profit above 55.5%. It is close to the Meta median of 2.19× reported by Varos in 2025.
It covers ad cost above a 26.3% margin and leaves 10% profit above 36.3%. It is above the published Google Ads medians (3.31–3.52×).
It covers ad cost above a 20% margin and leaves 10% profit above 30%.
It covers ad cost above a 14.3% margin and leaves 10% profit above 24.3%. Check what drives it: brand search and retargeting often produce 7× while bringing few new customers.
Break-even on new-customer ROAS: 1 ÷ your margin, so 2.5× at a 40% margin. Go below it only if repeat purchases pay back the first order within a payback window you have written down.
The studies publish medians, not means: 2.19× on Meta and 3.31× on Google Ads (Varos, 2025), 3.52× on Google Ads (Focus Digital, 2026). Medians vary more by industry than by channel.