Metrics
Three families of metrics make up every Level report — system, custom, and the formatting Level applies automatically by name.
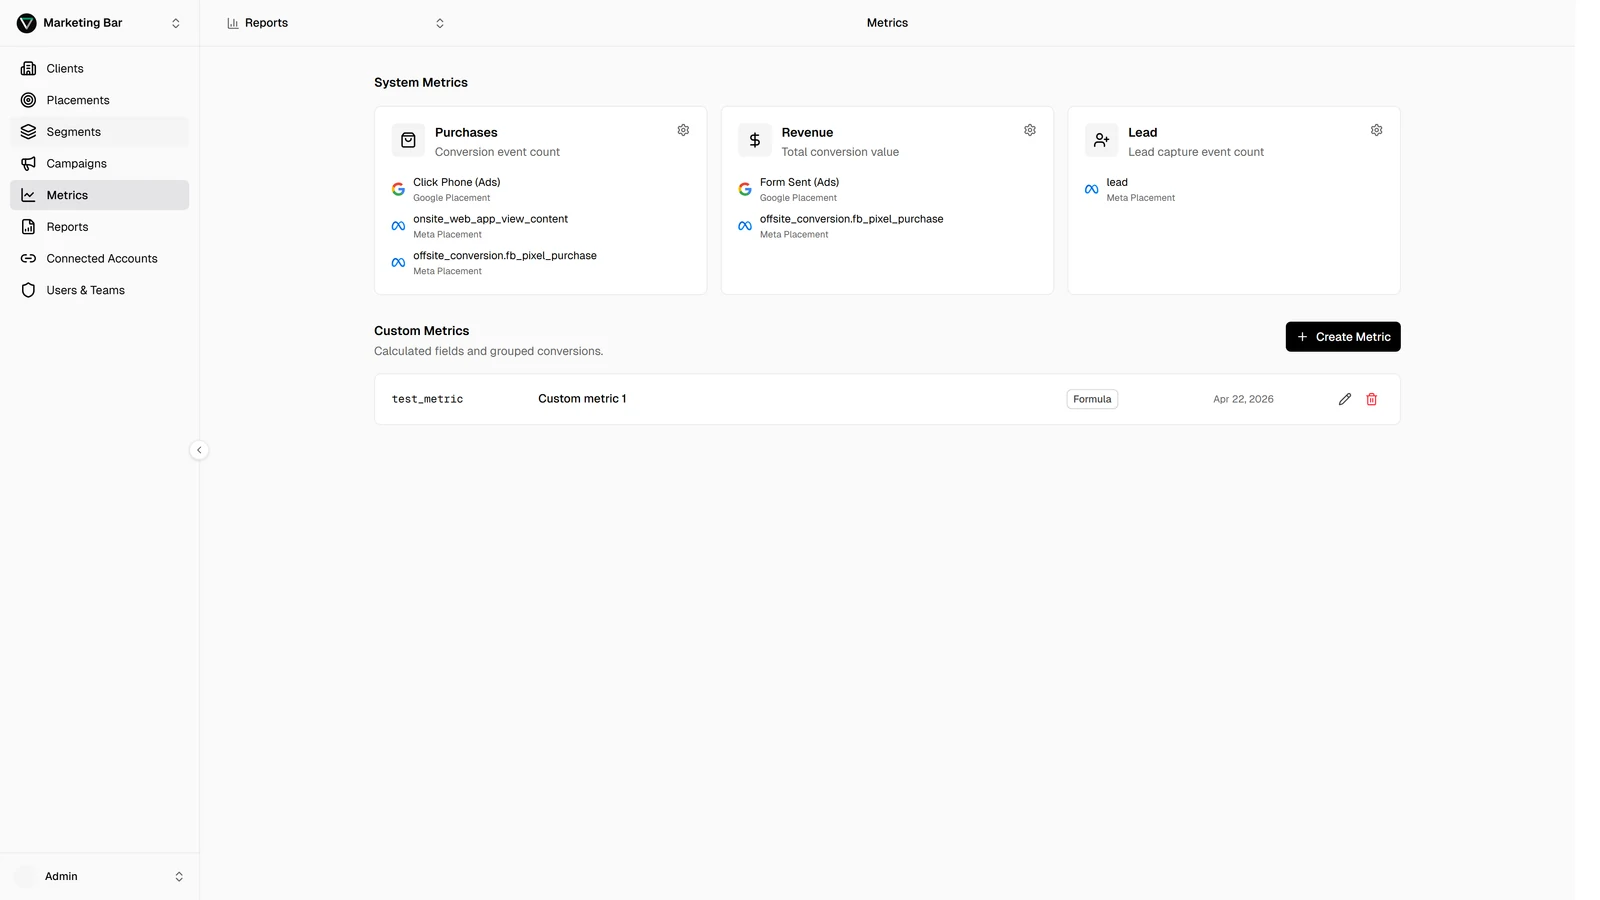
A metric is a number you can put in a report column. Level defines metrics per client at the Metrics page. The page has two sections: system metrics at the top and custom metrics in a table below.
The three families
System metrics
There are exactly three: Purchases, Revenue, and Lead. They're built into Level and present on every client. Each one shows as a card on the metrics page, with:
- Its name and a short description.
- An icon (shopping bag for Purchases, dollar sign for Revenue, user-plus for Lead).
- The list of platform-side conversion definitions currently mapped onto it.
- A Configure button that opens the conversion-mapping modal.
System metrics don't measure anything by themselves — they need conversion mapping to know which platform events count as a "purchase" / "revenue event" / "lead". You configure that once per client; the same map drives every report.
Custom metrics
Anything you create yourself. Each custom metric is one of two types:
- Conversion sum — pick a set of platform-side conversion definitions; the metric is the total count or value of those events. Useful for metrics that don't fit Purchases / Revenue / Lead — e.g. "Newsletter signups" as the sum of newsletter-related conversion events.
- Formula — write an expression over other metrics with
+,−,×,÷, and parentheses. References to other metrics use#mentionsyntax in the editor; Level's editor auto-converts metric names you type. See Custom metrics for the editor and validation rules.
Custom metrics live in the Custom metrics table on the metrics page, with columns: Name (the short identifier you use in formulas), Display name (the label shown in reports), Type (a badge — Conversion sum / Formula), Created date, and an action menu (Edit / Delete).
Display formatting
You don't create this — Level applies it automatically based on the metric's technical name:
- Monetary (currency-formatted):
cost,revenue,cpa,cpm,aov. - Percent:
ctr— formatted with two decimal places and a%sign. - Ratio:
roas— formatted as3.58×(two decimals +x). - Counts (anything else): plain integer with thousands separators.
If you create a custom metric and name it roas, it auto-formats as a ratio. If you name it Smart ROAS, it falls back to count formatting because the matcher is name-based and looks for the exact tokens above.
What you'll do here
| Task | Where |
|---|---|
| Map platform conversions to Purchases / Revenue / Lead | Conversion mapping |
Build a metric like profit = revenue - cost | Custom metrics |
Build a metric like Total signups from selected platform events | Custom metrics — Conversion sum |
| Pick which metrics appear in a specific report | The report drawer — see Creating a report |
Order of operations
When setting a client up for the first time, the recommended sequence is:
- Add placements (so platform-side conversion definitions show up in the picker).
- Configure conversion mapping for whichever of Purchases / Revenue / Lead apply to this client.
- Create custom metrics that depend on system metrics (e.g.
cpa = cost / purchases,roas = revenue / cost). - Build reports — pick the metrics you've defined and the placements they should aggregate over.
You can reorder, but each step builds on the previous one — formulas can't reference metrics that don't exist yet.
In this section
- System metrics — Purchases, Revenue, and Lead, and what they actually represent.
- Conversion mapping — point platform-side conversion definitions at Level's three system metrics.
- Custom metrics — build your own with the formula editor or as a sum of selected conversion events.
- Derived metrics — ROAS, CPA, AOV, CTR, CPM, recreated as Formula custom metrics.