SEO, Traffic & Social tabs
What each SEO/SMM tab shows — search clicks and positions, site sessions and engagement, social posts and cadence — with week-over-week trends.
Once your Wire projects are linked, three tabs cover the organic side of the organization. All of them aggregate across every linked project, and every chart carries a week-over-week badge — the last 7 days against the 7 before, so the direction is visible without squinting at the curve.
SEO
Search performance from the linked projects:
- KPIs — clicks, impressions, and average position.
- Charts — clicks, impressions, and average position over time. The position axis is inverted: up means better, the way you'd expect.
- Top posts — the pages earning those clicks, with impressions and position.
- Tracked keywords — each keyword's current rank and how it moved.
If two linked projects share the same search-console property, one of them is skipped and the tab says so — otherwise the same site would be counted twice.
Traffic
Site analytics for the linked projects:
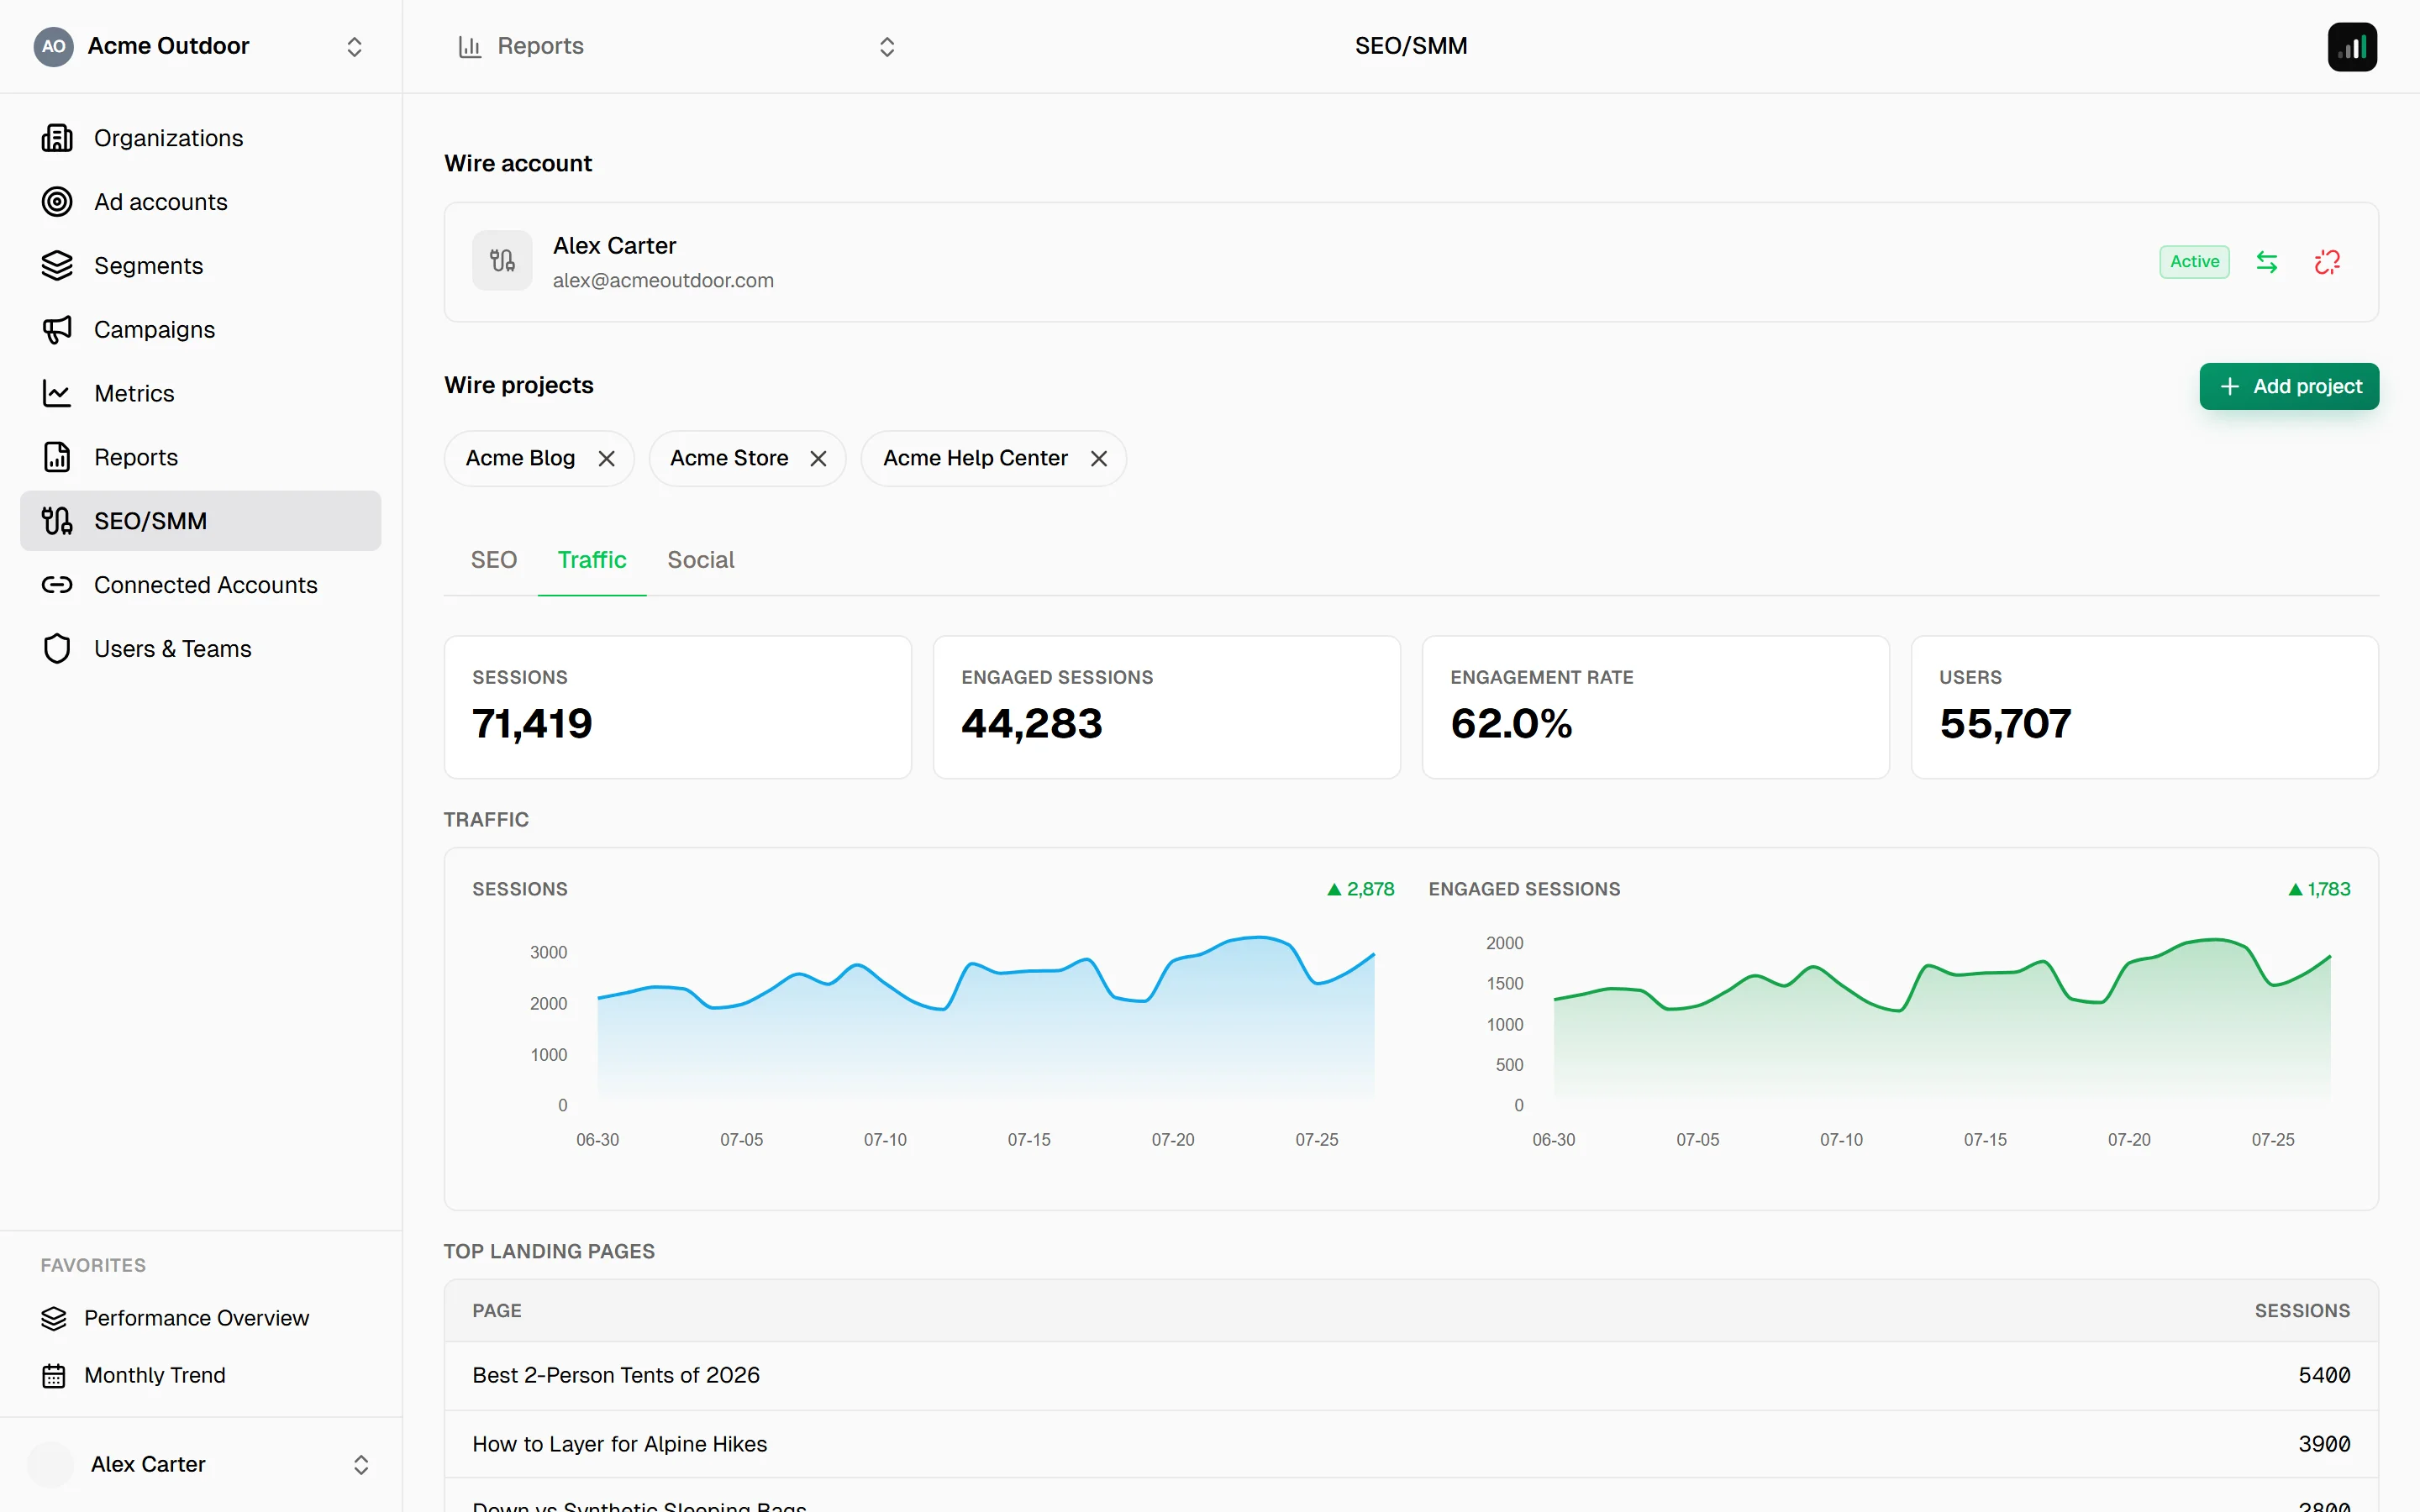
- KPIs — sessions, engaged sessions, engagement rate, and users.
- Charts — sessions and engaged sessions over time.
- Breakdowns — where the traffic comes from (channels and campaigns) and which posts drive it.
Social
Publishing activity across the projects' social channels:
- KPIs — posts, engagement, and clicks.
- Chart — posts published over time: your actual publishing cadence.
- Breakdowns — posts by status and by channel.
Freshness
The numbers refresh when you open the page; each project's status line shows when its data was last fetched. If a project shows stale data, it usually means the Wire connection behind it needs a reconnect.