Placements report
Rows = placement groups you define inside the report. Best for channel-level rollups.
A Placements report rolls placements up into groups you define on the report itself. It's the "paid social vs paid search vs PMax" view — the channel breakdown a CMO is most likely to ask for.
Why groups, not flat placements
The first instinct might be "why can't a Placements report just show one row per placement?" The answer: it could, but it's typically not useful. A real account might have:
- 4 Meta ad accounts (different markets / business units)
- 2 Google Ads accounts (Search + PMax)
A flat-placement report has 6 rows — but the meaningful breakdown is 2 rows: Paid social and Paid search. Groups let you collapse the 4 Meta placements into one Paid social row and the 2 Google placements into Paid search.
If you only have one placement per channel, a group with one placement still works — it just looks the same as a flat row.
Building one
In the report drawer:
- Type → Placements.
- Groups — define one or more. Each group needs:
- A name (free text, shown as the row label).
- A placement set (multi-select; a placement must be in exactly one group of the report).
- Metrics → multi-select.
Drag handles let you reorder groups; that order is the row order in the resulting table. There's no separate "Placements" multi-select for the report — you choose them per group.
Common group patterns
| Group | Placements |
|---|---|
| Paid social | All Meta placements (Facebook + Instagram + Audience Network surfaces). |
| Paid search | Google Ads Search + Shopping + PMax placements. |
| Display | Google Display Network placements. |
| Video | YouTube placements. |
Pick groupings that match how the team actually budgets and reports.
Editing groups later
Open the report's Edit drawer:
- Reorder groups — drag.
- Rename a group — open the group via the edit pencil.
- Add / remove placements from a group — same modal.
- Add a new group — Add group button.
- Delete a group — bin icon. Placements that were in it become available for other groups; data isn't lost.
Group order in the drawer = row order in the resulting report. There's no per-viewer reorder for Placements reports — the group structure is part of the report definition itself.
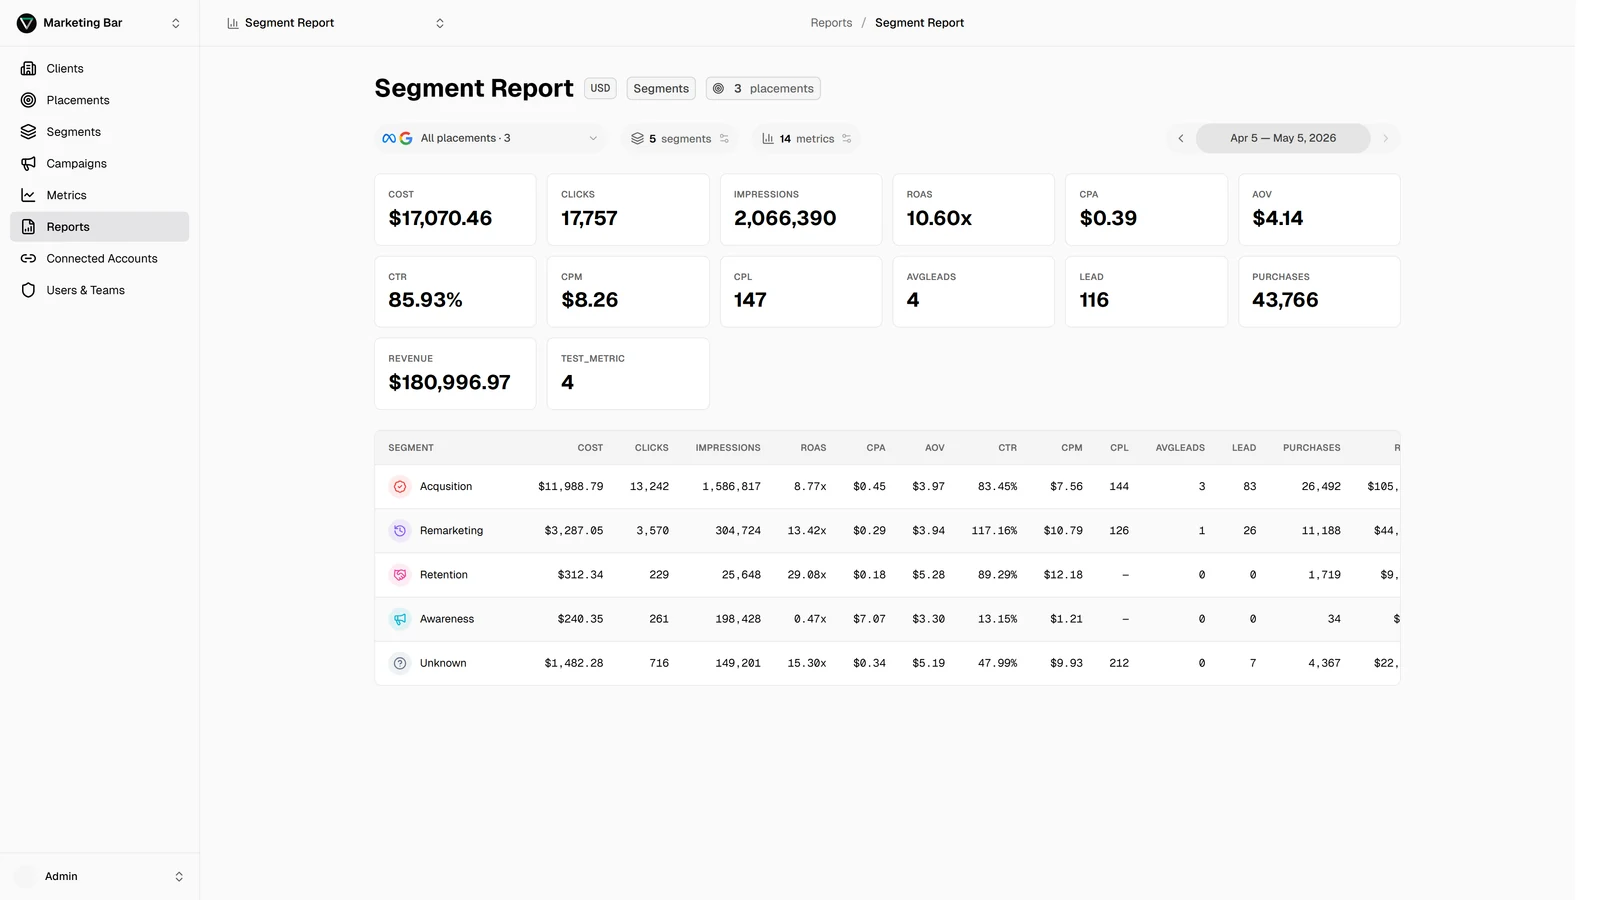
What the table shows
Each row is one of your groups. The left column is the group name; metric columns are the rolled-up totals across every placement in the group, over the chosen date range.
KPI cards at the top show the total across all groups, not the sum-of-rows (so they correctly represent the report total even if your group definitions overlap — though they shouldn't, since each placement is in exactly one group).
Best for
- Channel-level board / CMO views.
- Comparing paid social vs paid search P&L treatments.
- Spotting which channel is over- or under-pacing for the period.
Not ideal for
- Per-placement scrutiny → use a Campaigns report and filter by name pattern.
- Funnel intent → use a Segments report.
- Trend lines → use a Months report.