Segments report
Rows = segments. Best for stakeholder rollups that group campaigns by intent.
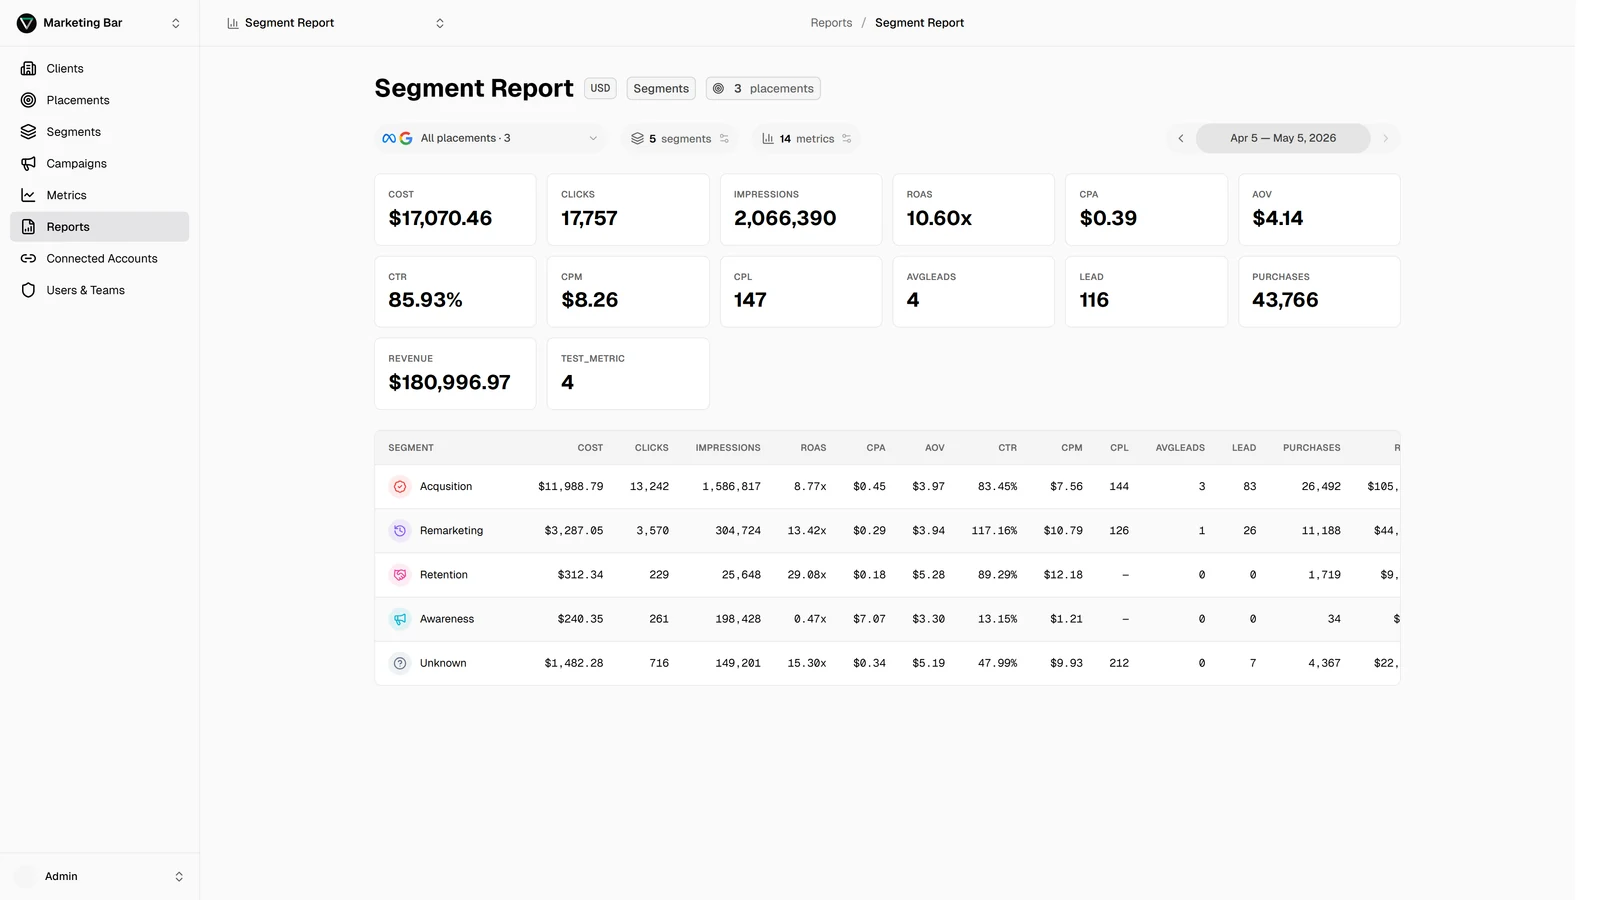
A Segments report is what you build when the audience cares more about Acquisition vs Brand vs Retention than which specific campaigns are in flight. Every row is one segment; metrics are the rolled-up totals across every campaign tagged with that segment, on every placement included in the report.
What you need
- Segments defined on the client — see Segments.
- Campaigns tagged with those segments — see Assigning segments.
- At least one placement chosen for the report.
A campaign that isn't tagged with any of the report's selected segments doesn't contribute to any row of this report. Tagging coverage matters.
Building one
In the report drawer:
- Type → Segments.
- Placements → multi-select. Aggregation is across them.
- Segments → multi-select; this is required for Segments-type. Use Select all / Clear all to flip the whole list.
- Metrics → multi-select.
What the table shows
Rows are the segments you picked, in the order you set (drag to reorder per-viewer in Customize segments). Each row:
- Left column (sticky on desktop): segment colour swatch + name.
- Metric columns: the rolled-up values across all campaigns tagged with that segment.
Mobile renders the same data as cards instead of a sticky table.
How rows are computed
For each segment you picked:
- Find every campaign on the report's placements that's tagged with this segment.
- Sum each metric across those campaigns over the date range.
- Render that sum in the cell.
A campaign tagged with multiple segments contributes to all of those rows. That's intentional — campaigns that target both Acquisition and Brand legitimately count toward both.
Because a multi-tagged campaign counts toward multiple rows, summing the rows of a Segments report won't necessarily equal the report's total — unless every campaign has exactly one segment. The KPI cards at the top show totals across all placements (not the sum of rows), so they're correct.
Customising the view
Per-viewer customisations on top of the saved report definition:
- Reorder rows — drag handles in the customize-segments modal.
- Hide segments — uncheck them to drop the row (they keep contributing to the placement total though, since hidden ≠ excluded).
- Reorder columns / hide metrics — same model, in the customize-metrics modal.
See Customizing a report for the full layer model.
Best for
- Quarterly business reviews — what did each segment of the funnel contribute?
- Stakeholder dashboards — here are the four buckets that matter.
- Cross-platform comparisons within a single intent — how did Acquisition do across Google + Meta?
Not ideal for
- Single-campaign drilldowns → use a Campaigns report.
- Trend over time → use a Months report.
- Channel-level views → use a Placements report.