Reading the Wire numbers
The five headline metrics, the windows each one covers, how the week-over-week comparison is calculated, and what the content table shows.
Once projects are linked, the screen is one row of metrics, one chart and one content table — all scoped to whatever the project rail has selected.
The metric row
Five tiles, and the row doubles as the chart's switcher: clicking a tile plots it.
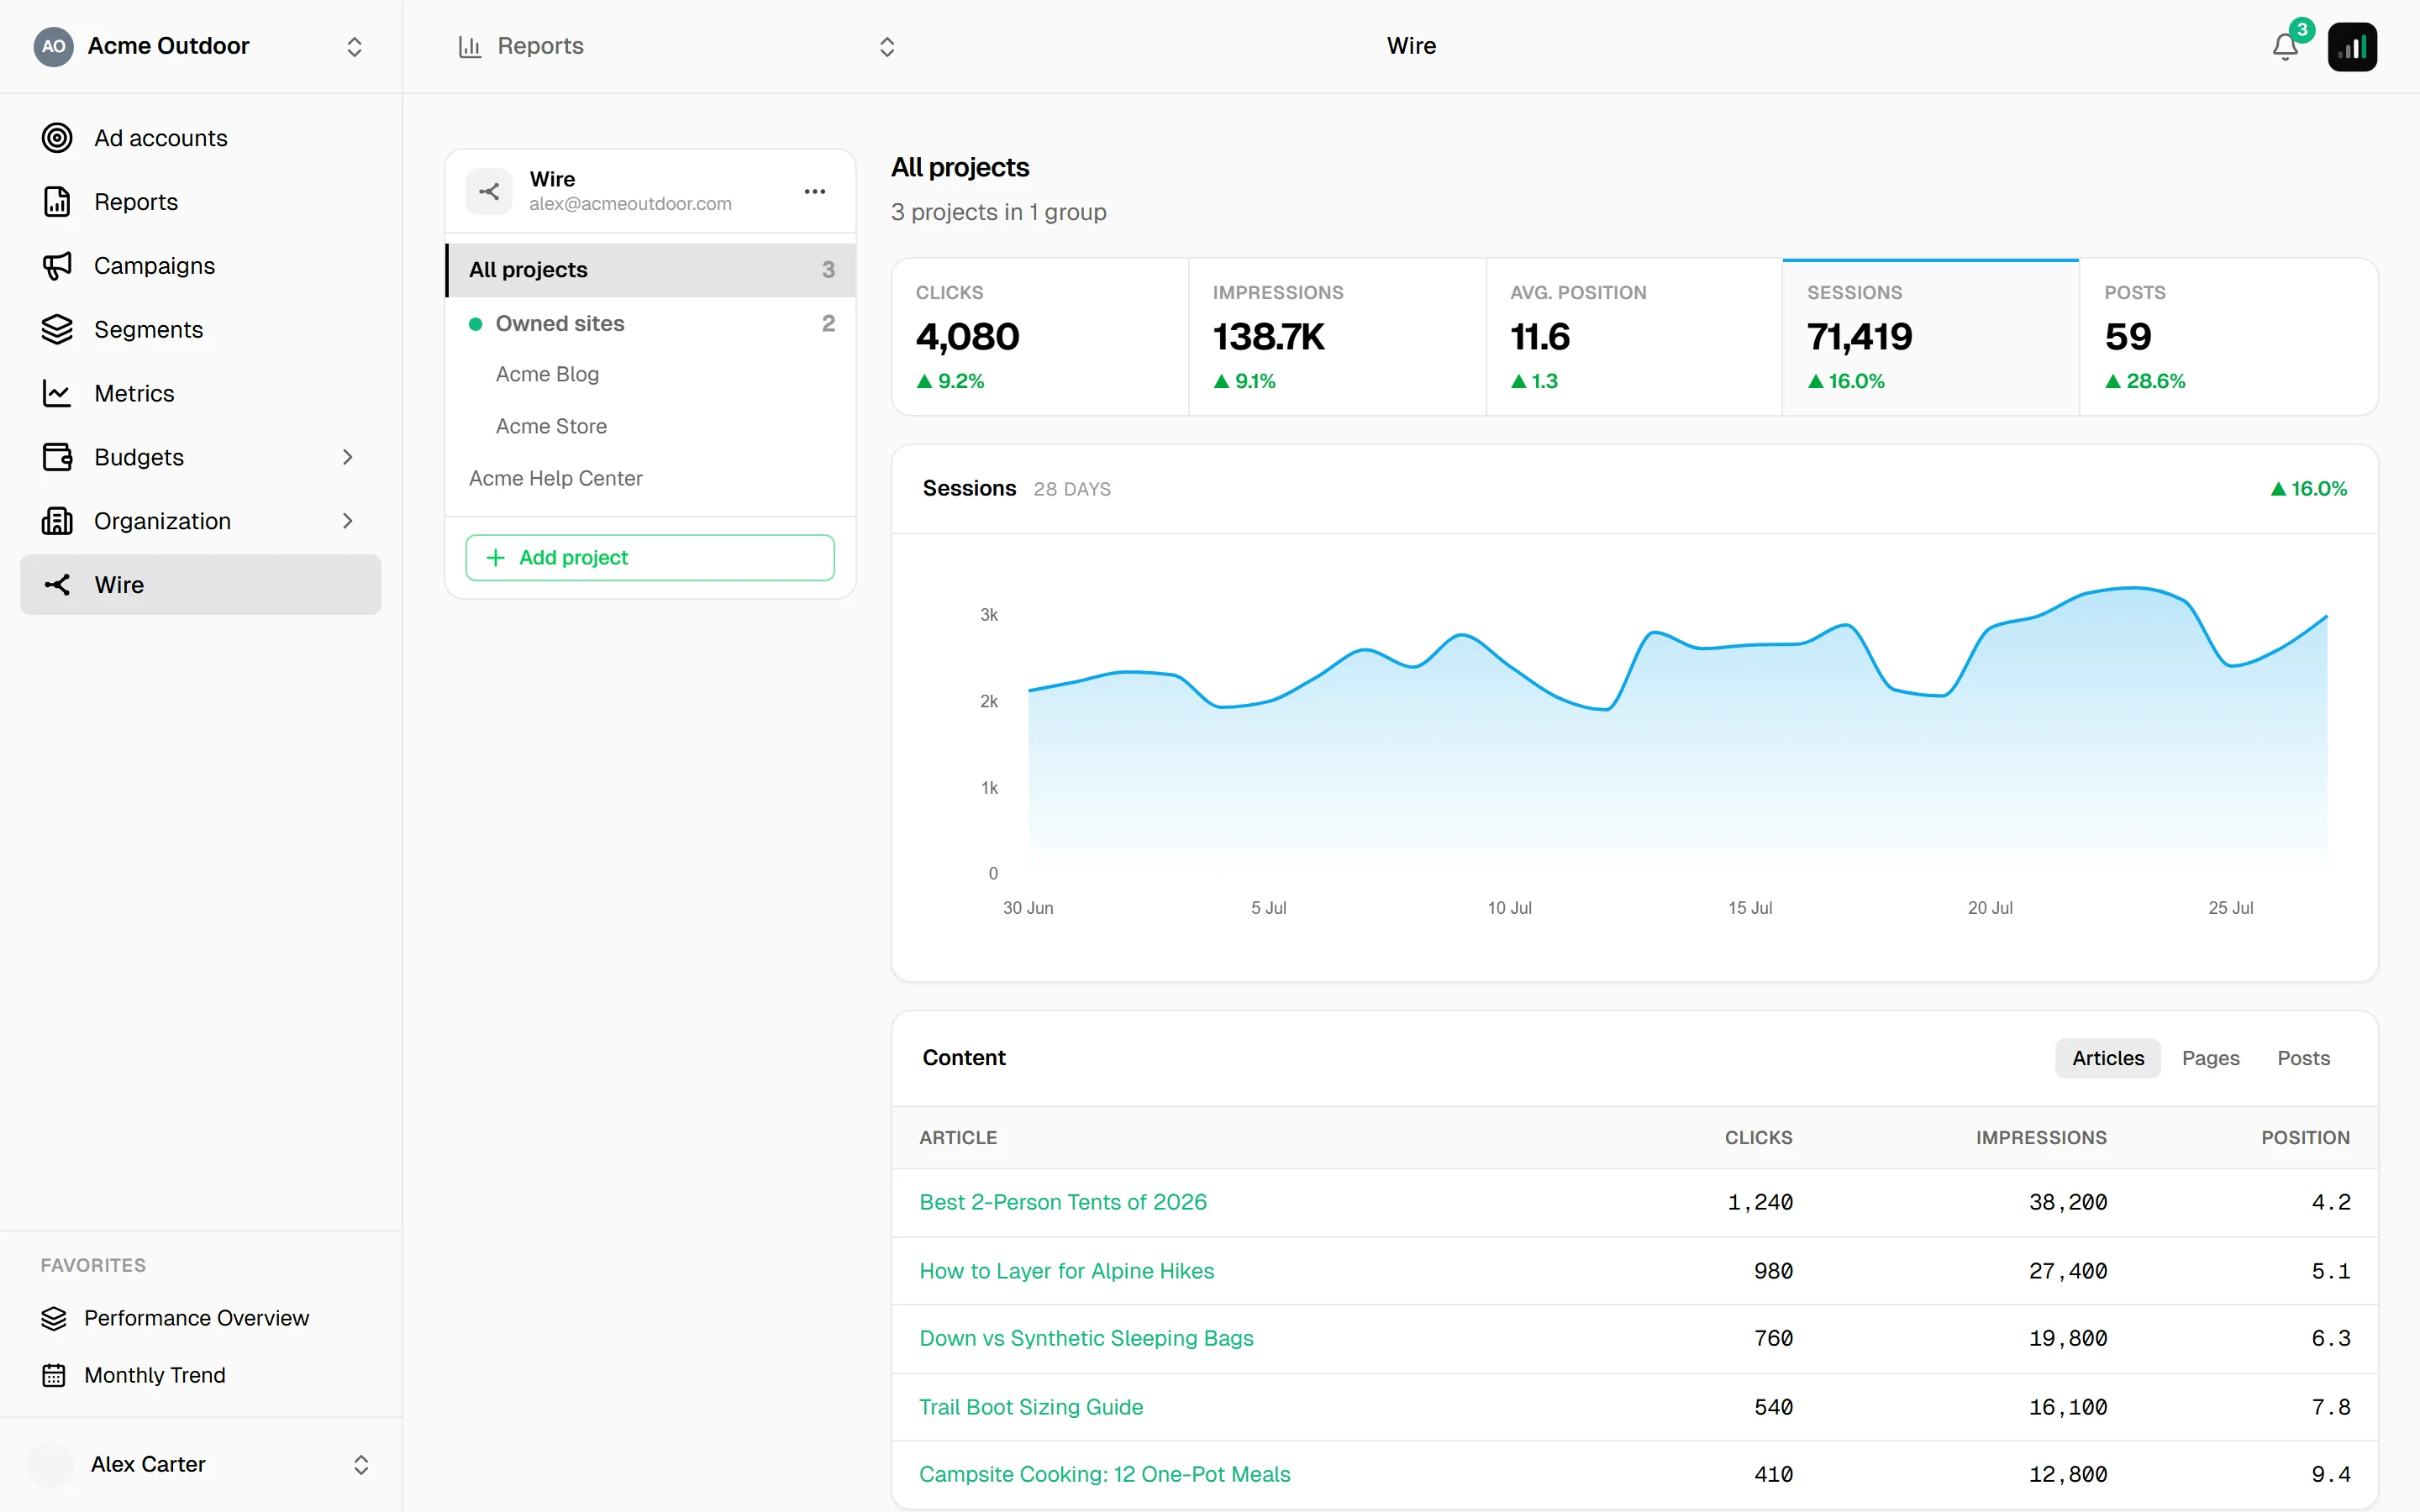
| Metric | From | What it is |
|---|---|---|
| Clicks | Search | Clicks from organic search results. |
| Impressions | Search | How often the pages appeared in results. |
| Avg. position | Search | Average ranking position. |
| Sessions | Site analytics | Visits to the site. |
| Posts | Social | Posts published. |
A metric whose source isn't connected — no site-analytics property, no social channel — stays in the row as an inert — tile with the reason, rather than disappearing. The row never reflows while the page loads, and you can always see what you're not getting.
The deltas
Every tile carries a comparison badge: the last 7 days against the 7 before, or four weeks against four for the weekly publishing cadence.
Every delta is oriented so that positive means better — including average position, where the raw number going down is an improvement. The chart negates it too, so the line rises as the ranking improves.
The windows are Wire's, not yours
There is no date-range picker here, and that is honest rather than missing: Wire fixes the window per source. Search data covers roughly the last 90 days, top pages the last 28, publishing cadence about 12 weeks.
So the chart labels its own window from the data it actually received — 90 days, 12 weeks — instead of promising a range it can't deliver.
The content table
Below the chart, one table with three readings of the linked projects' content:
| Tab | |
|---|---|
| Articles | Published articles with their search performance. |
| Pages | Site pages with theirs. |
| Posts | Social posts, sortable, with reach and engagement. |
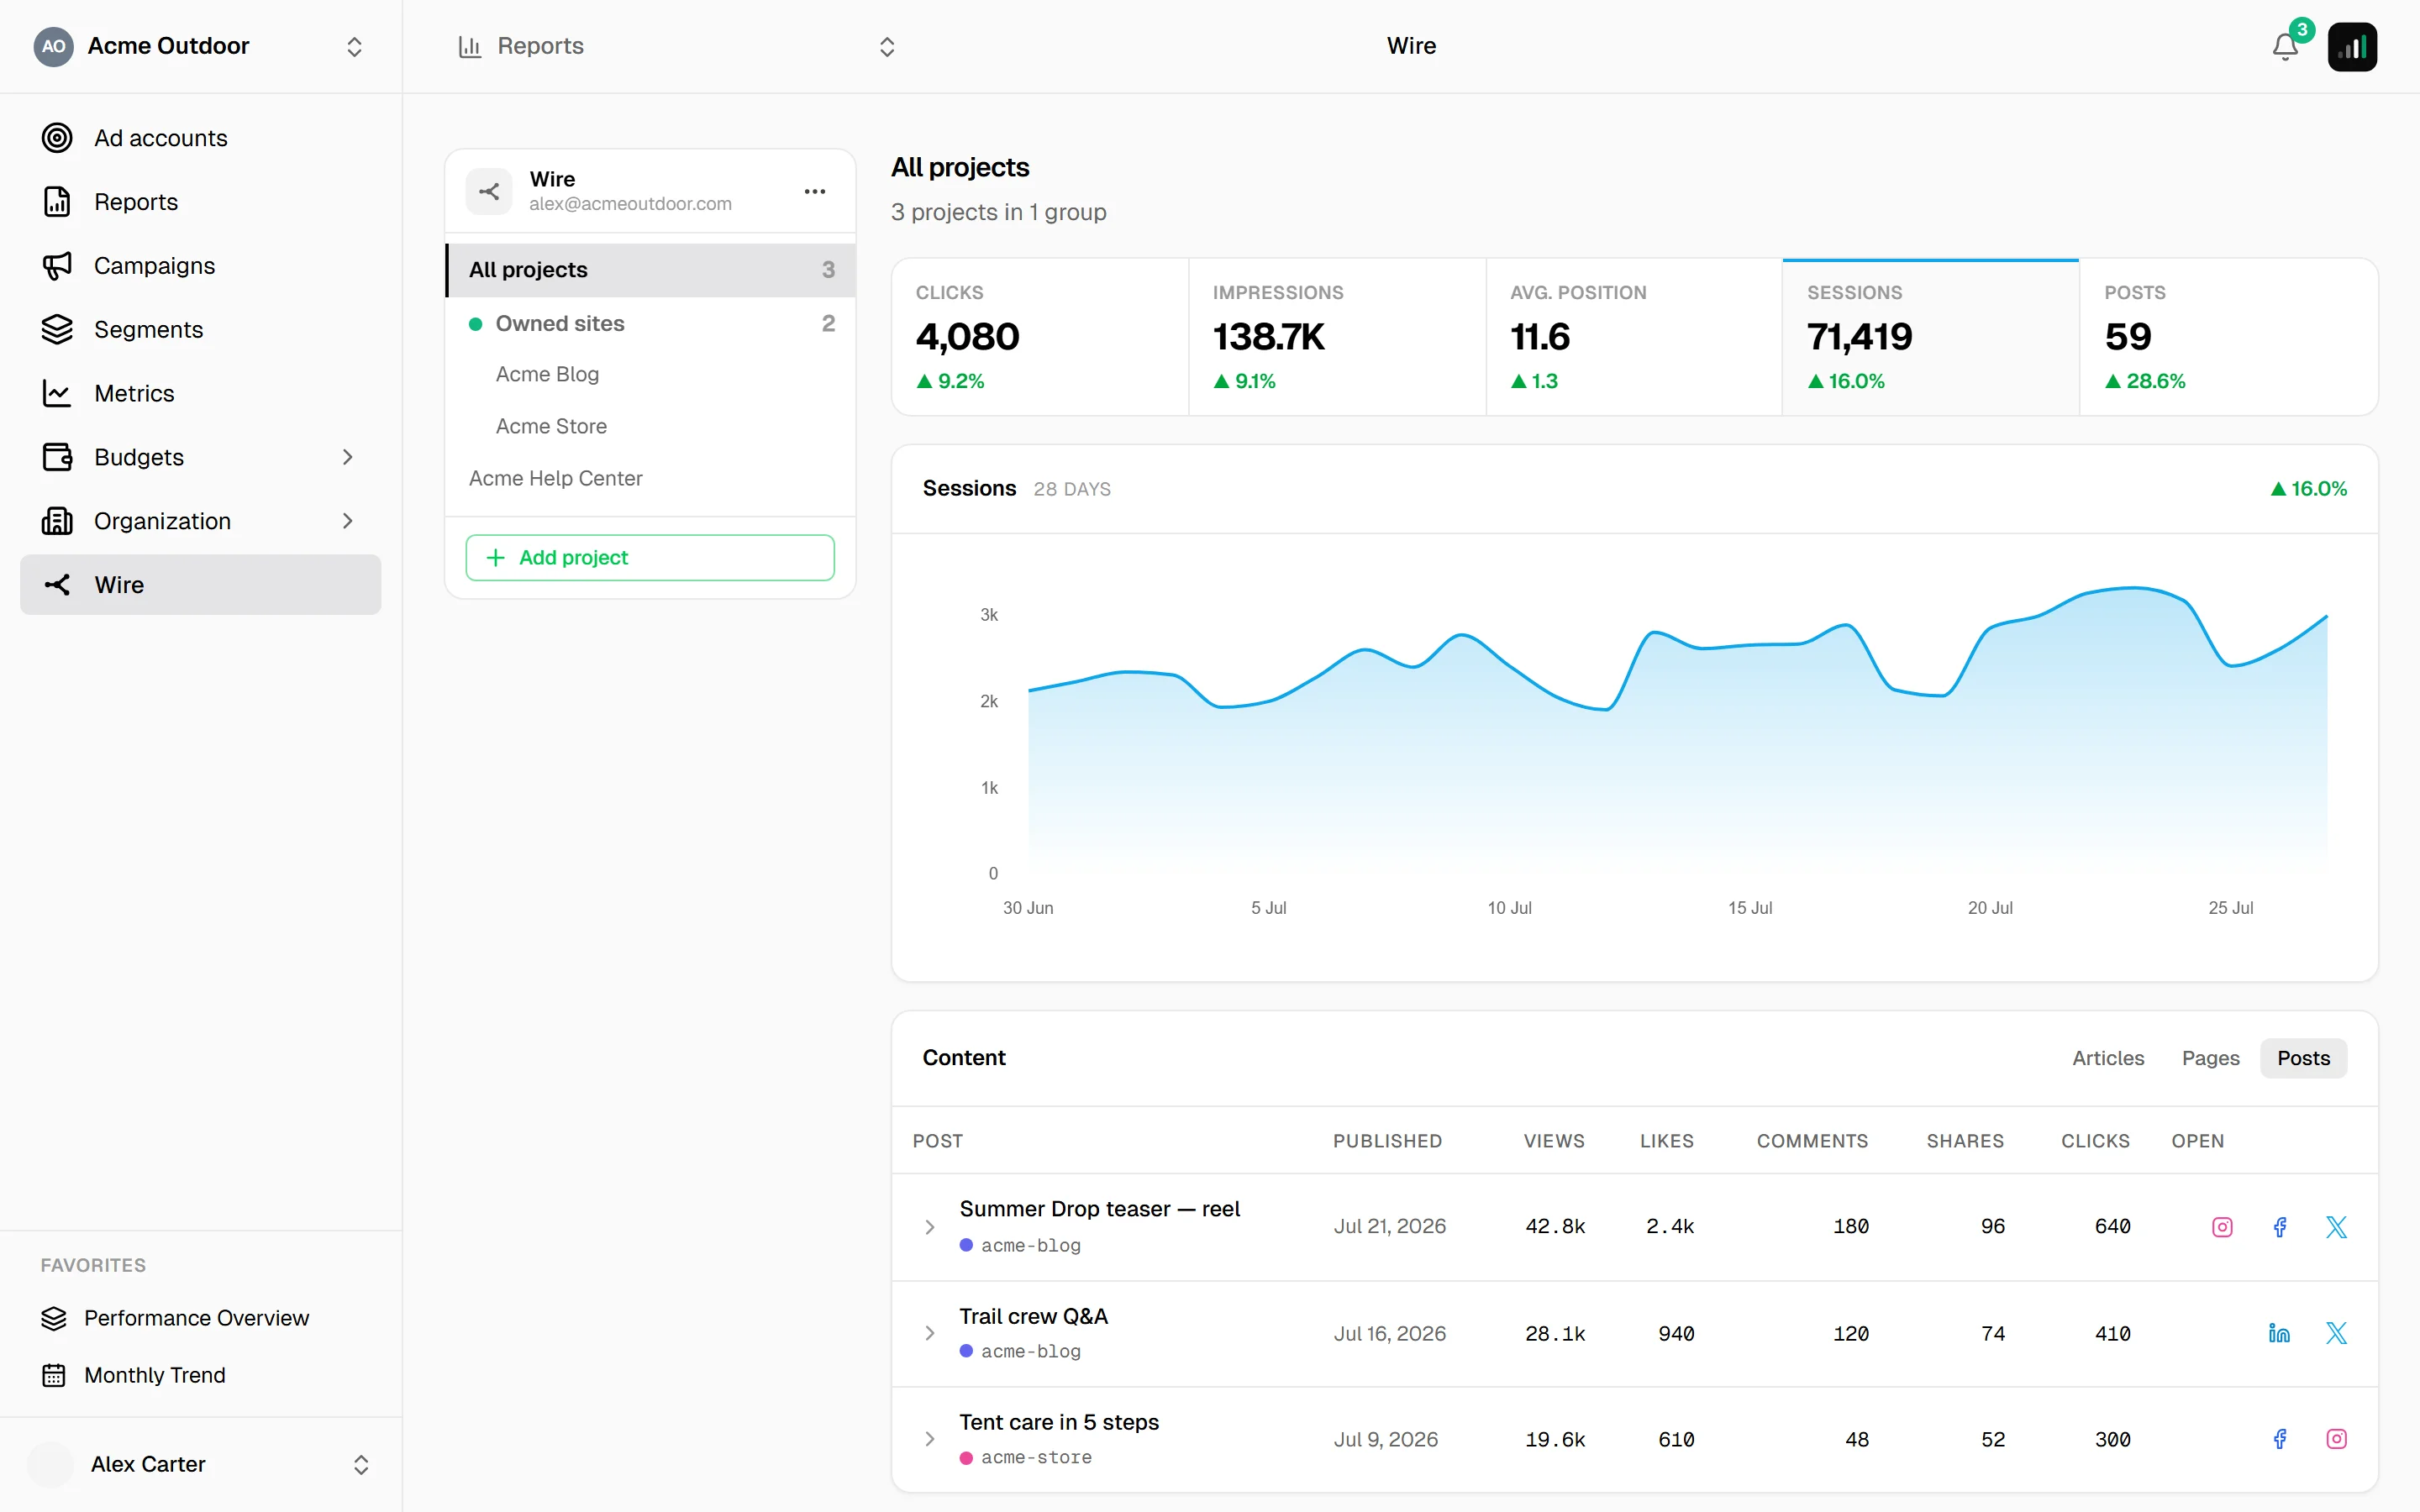
Titles link back into Wire, so the piece itself is one click away.
Freshness
The numbers are fetched when you open the page, and cached briefly so switching between projects on the rail is instant. If a project shows stale data, it usually means its Wire connection needs a reconnect.